It’s no secret that China is building massive military facilities on former reefs known as the Spratly Islands. But what exactly are they doing, and at what pace?
Using Simularity’s Automatic Image Anomaly Detection System (AIADS), we can analyze a candidate image against a set of historical images, as the AI can learn from the history and filter out all the usual changes so that the abnormal ones can be highlighted. The result is a powerful, intelligence packed, “heatmap” showing the most significant unusual changes which can then be further analyzed by geoint analysts – some using higher resolution imagery or other sensor data (e.g. lidar, SAR) when necessary.
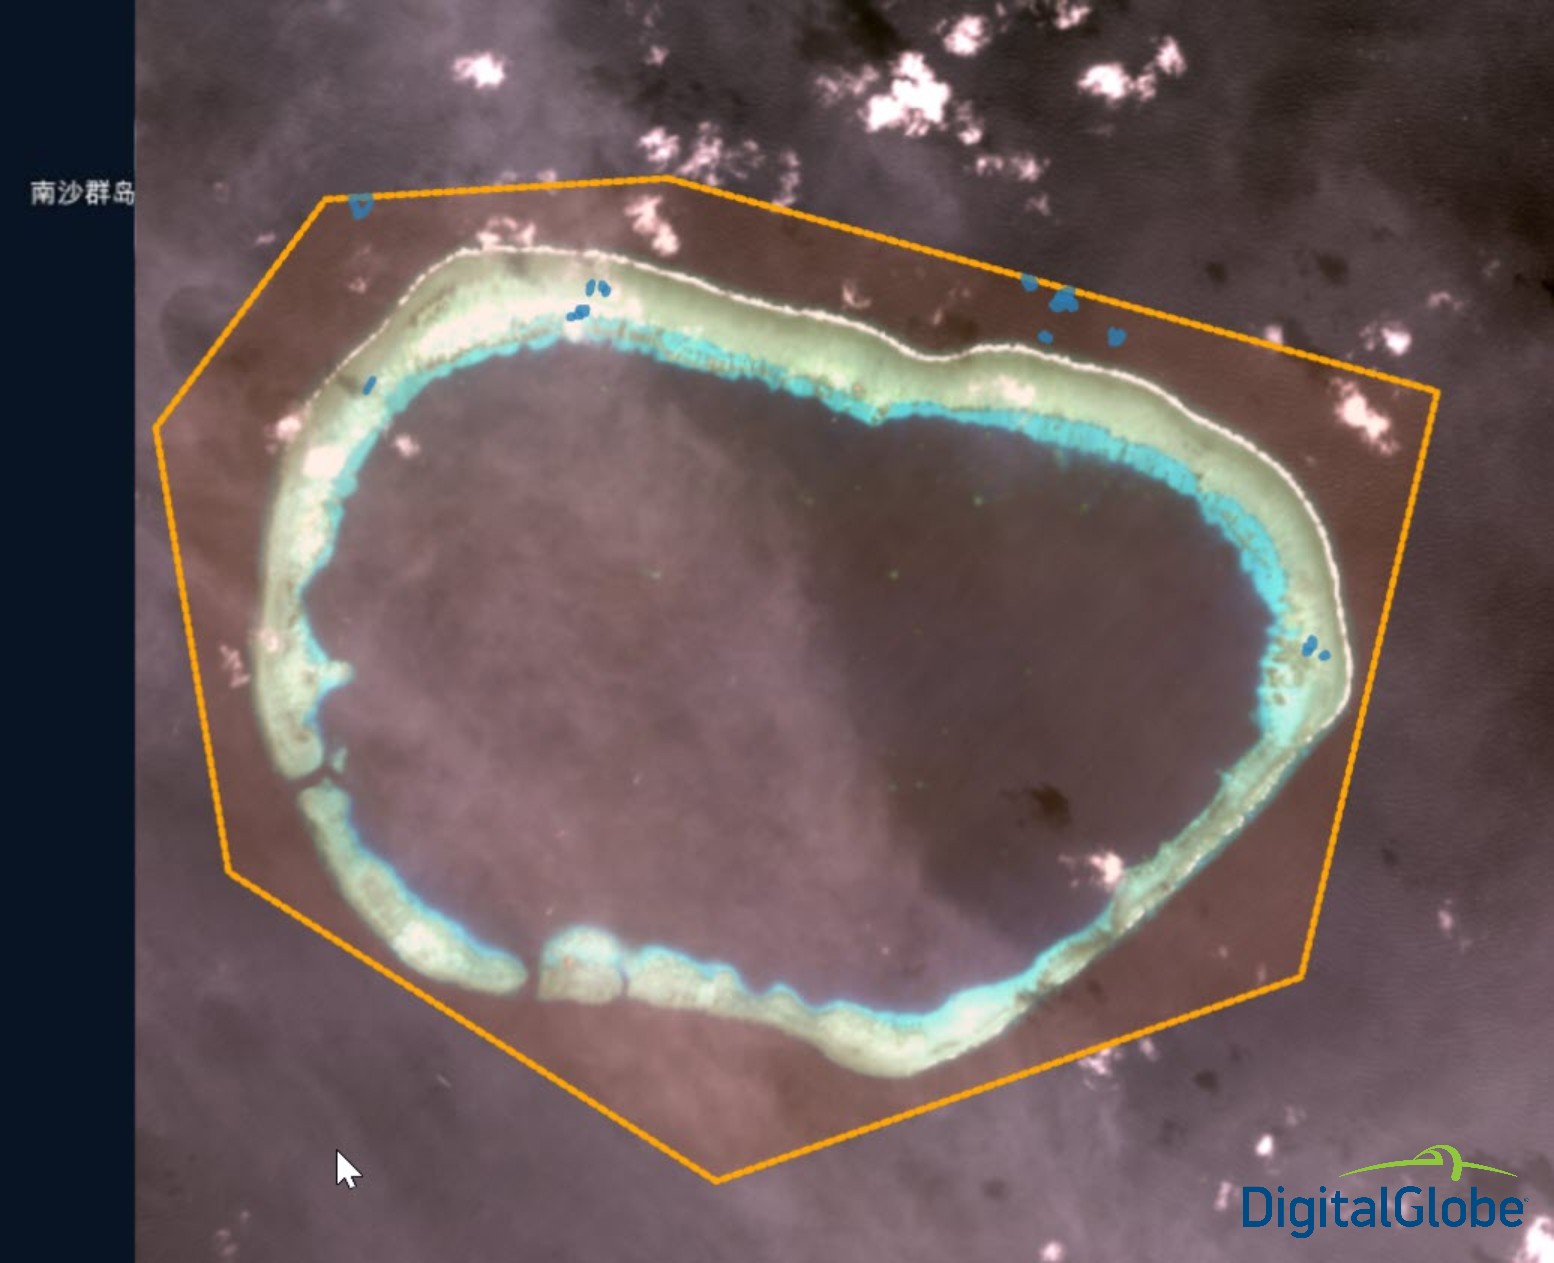
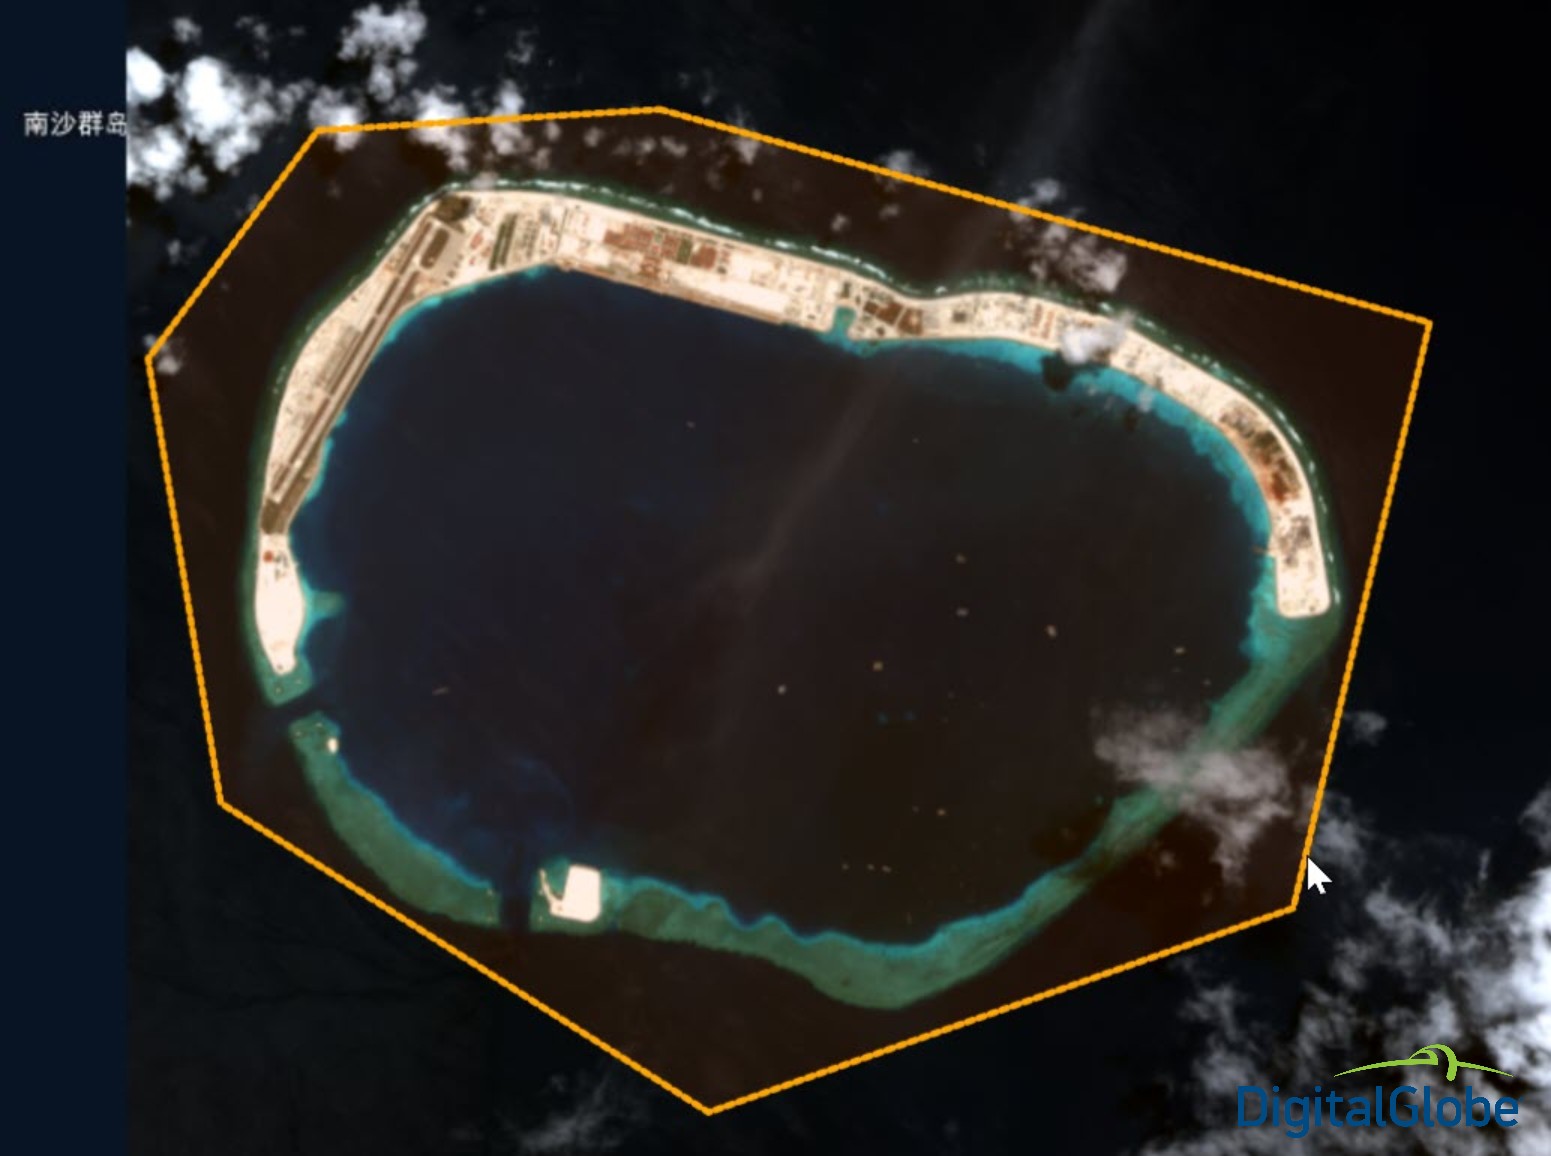
Reefs, such as aptly named Mischief Reef below, used to be beautiful natural formations in the waters contested by Vietnam, China, Malaysia, Taiwan, and the Philippines.
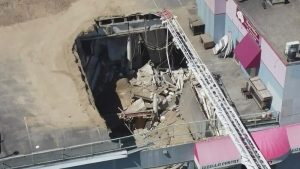
Using sophisticated (coral destroying) dredging systems, the Chinese are rapidly pulling material up from the bottom in order to fill in these reefs and raise them up for further construction. After building airports, the reefs have been built up with a variety of structures, such as what you now see in this image from May, 2018:
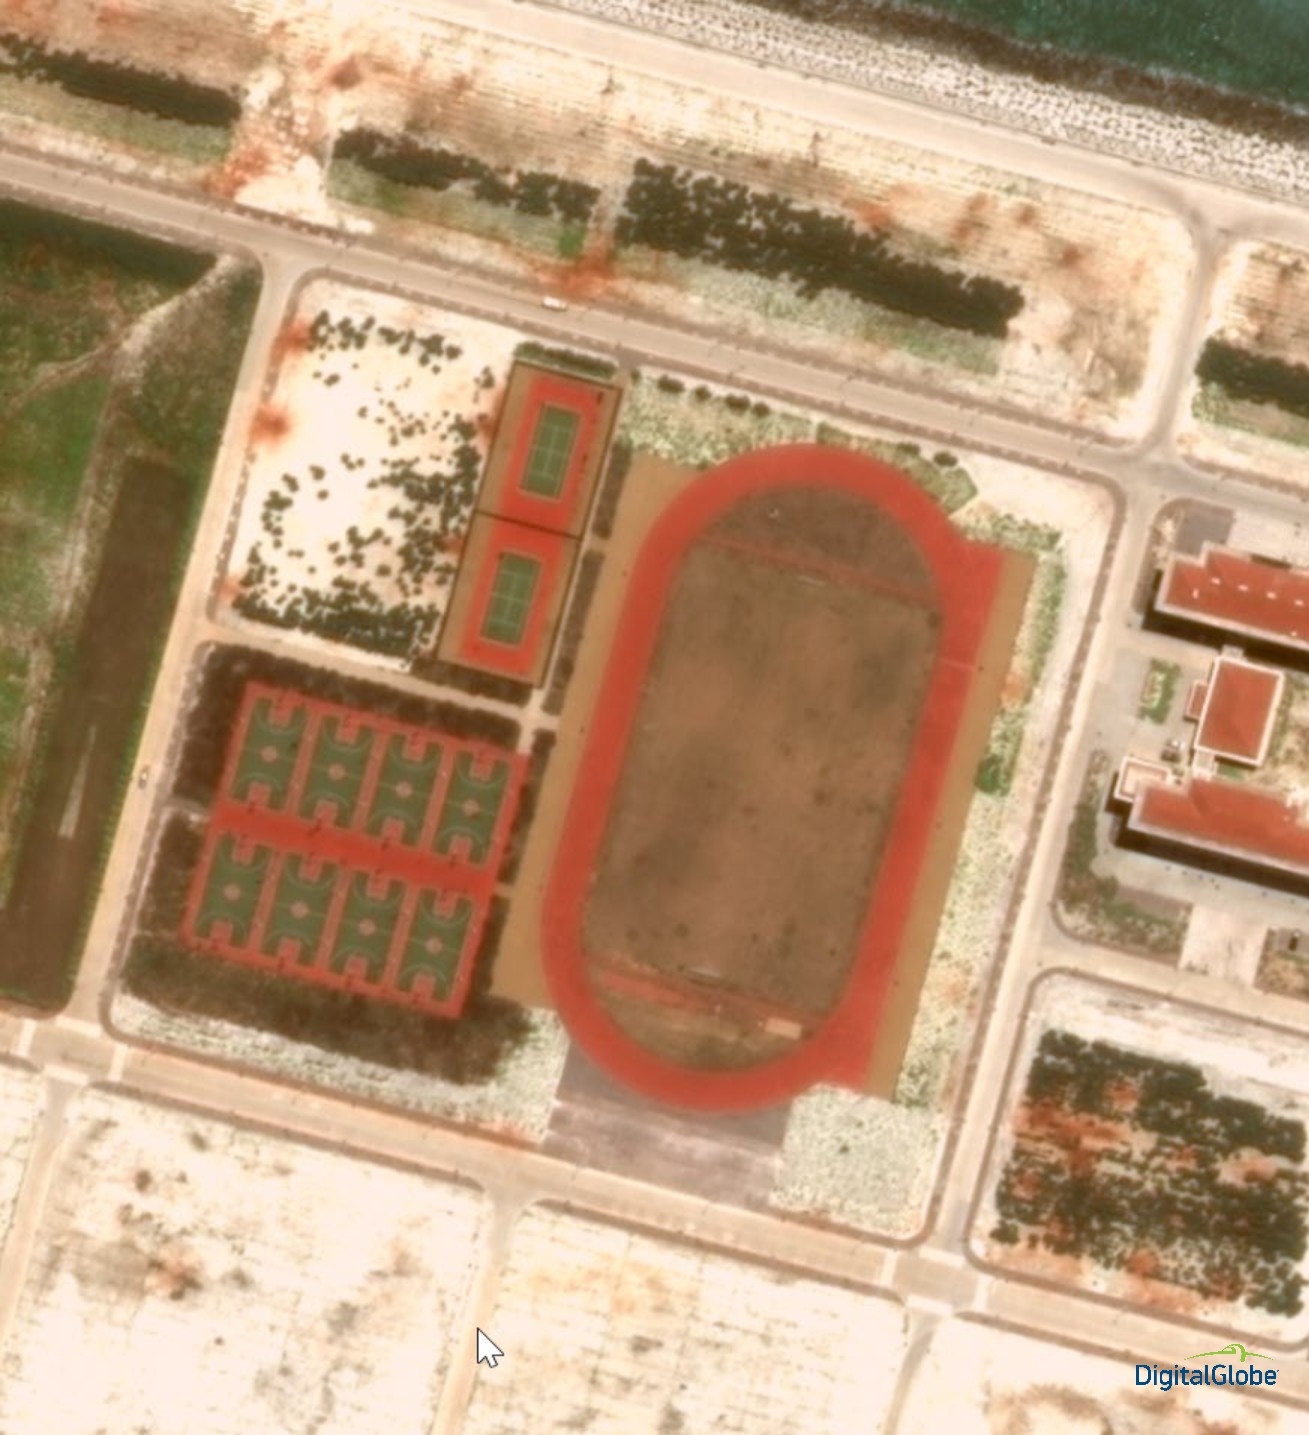
With the high resolution of these DigitalGlobe images, you can see structures such as sports facilities below, where they seem to enjoy running, tennis, and basketball:
So what are they really up to? And how do you track all the changes? With traditional change detection tools all you get are busy “pixel diff” images showing every possible change, including the water movement, sand shifting, vegetation (what’s left on these concrete pads), and otherwise normal activity. What about construction or materials that are coming and going? If you know what’s being consumed and delivered, you can get a very good estimate of what resources are targeting different projects.
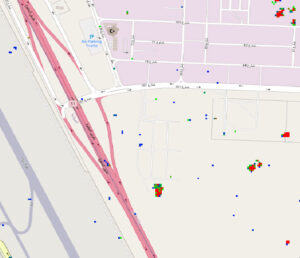
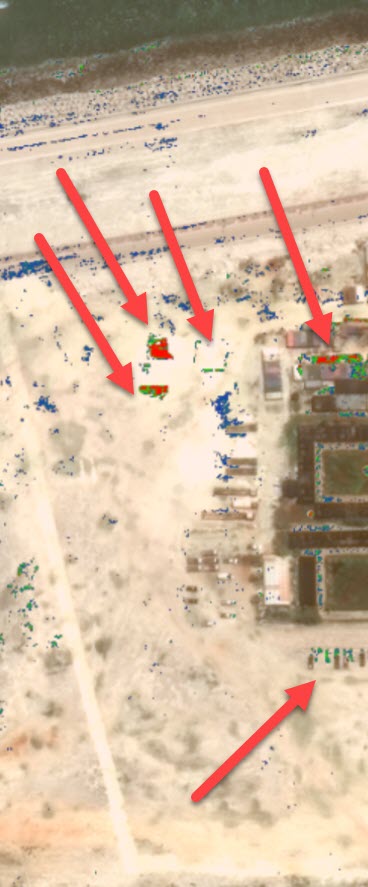
Here’s an example of AIADS having analyzed an Area of Interest on Mischief Island. What you see are the most recent before image, the candidate image from May 6, 2018, and the anomaly heatmap generated by the AI. You’ll see that it’s very easy to spot the key differences, highlighted by the red pixels in the anomaly image:
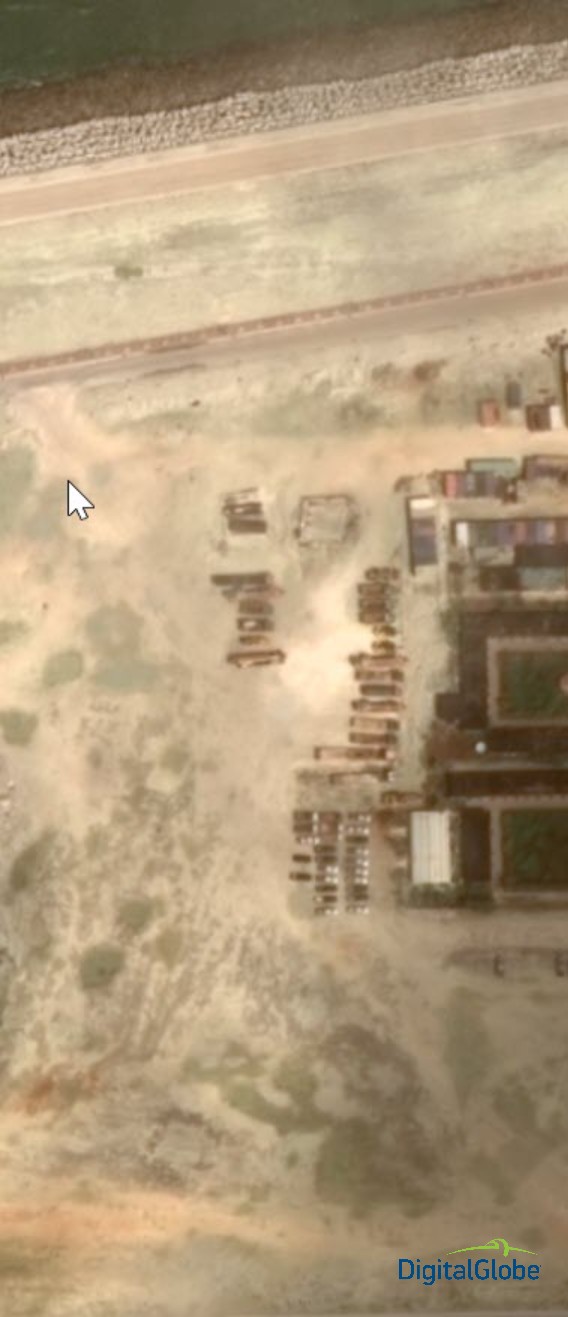
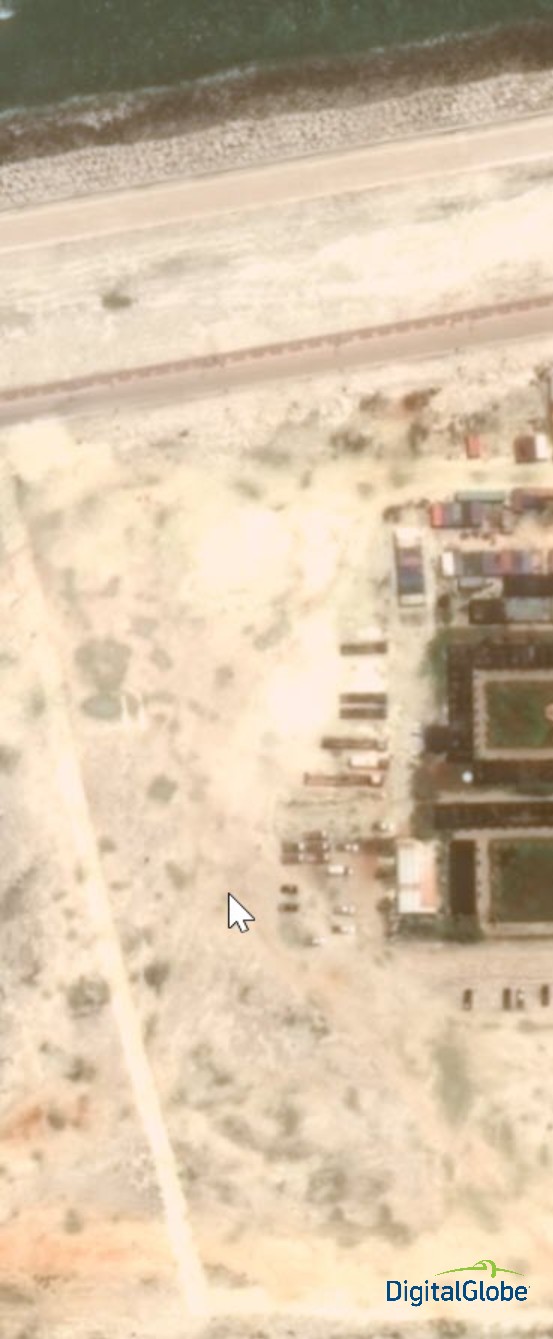
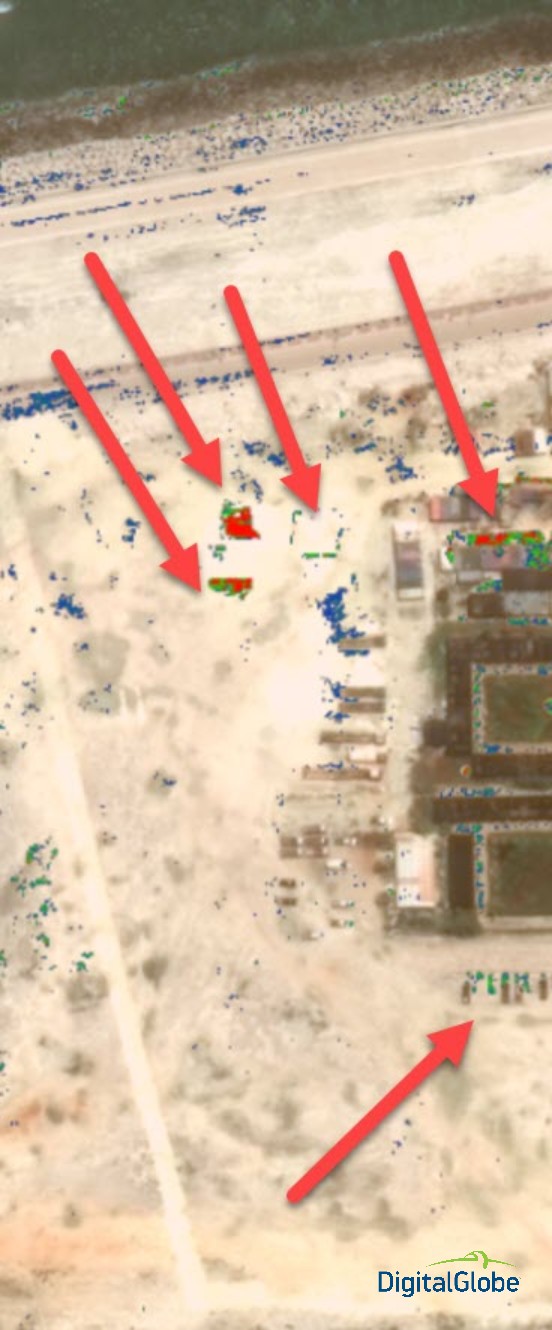
The anomalies appear to be movement of shipping containers used for construction materials for nearby buildings. By keeping a close eye on these sorts of changes, we can get more valuable intelligence regarding what is really happening on these reefs.