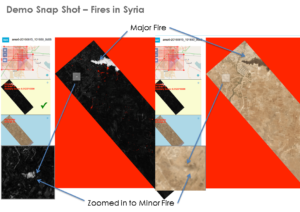
On March 1, 2016, this mysterious fire erupted in the desert approximately 10 miles northwest of the Ali Al Salem Air Base – just west of Kuwait City and about 20 miles from the Iraqi border.

What caused it?
Was it an oil rig fire, a failed missile strike, a “normal” munitions testing event for that area or something even more sinister?
Without a system to keep an eye out for such anomalies, significant changes on the ground – especially the ones that are not obvious or reported – can be a serious matter for defense, the environment, and other interests commercial and public.
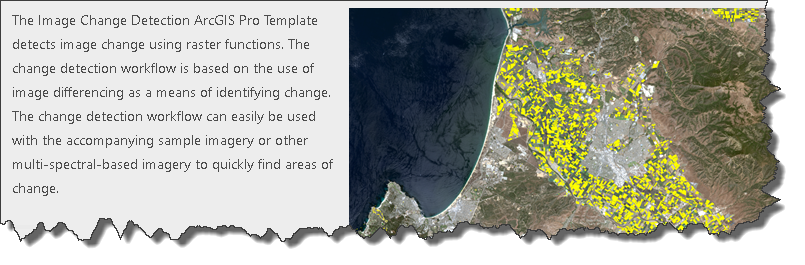
Most public and private organizations have “change” detection systems that use satellite imaging data to compare 2 or 3 images at a time, in order to alert the analysts to changes they should study further.
But is change what people really need to know about?
You see, some changes are normal – such as movement of tidal waters, shifting of sand dunes, cars appearing in a parking lot etc. And other changes can be abnormal – such as sudden appearance of smoke, unexpected activities involving large vehicles near a border, or strange construction happening in an area that normally sees little change.
So “change” is really not what people want to see. What they really want is to study the unusual changes – things that are outside the norm.
Most analysts have learned to tell the difference between the “normal” changes from the “abnormal” ones, as they are actually looking for the unusual events beyond just simple changes. This is almost a subconscious extra step that is taken, due to the fact that the technology available to date doesn’t truly find the unusual changes.
To date, no commercial product has been made available that solves the challenge of anomaly detection in satellite imagery. In fact, as recently as July 2016, in a IEEE conference paper entitled “CONTINUOUS ANOMALY DETECTION IN SATELLITE IMAGE TIME SERIES BASED ON Z-SCORES OF SEASON-TREND MODEL RESIDUALS” by Zeng-Guang Zhou, it was stated that “Although many time-series-analysis methods have been developed for change detection, to the best of our knowledge, few methods focus on continuously detecting anomalies in satellite image time series.”
The Problem With Change Detection Tools
Until now, Image analysis tools have claimed to support “change detection” – some sort of comparison of 2 or maybe 3 images. But these tools are primitive for the following reasons:
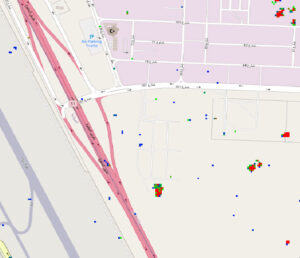
- The tools only perform change detection – not anomaly detection. Such as this one:
ArcGIS change detection tool It’s up to the analysts to take the extra step and look at changed areas of interest, and visually inspect further what’s really going on: is it a normal change or not? Or, is there a change that should occur normally but now is not happening? – very few technologies can spot these anomalies.
- As the cost of new and small satellites comes down, we’re seeing new sats and constellations of sats being launched almost daily. All these streams of data are turning into a tsunami. To make matters worse, from a processing point of view, the resolution is getting finer over time and the frequency of the data is increasing, which is compounding the issue further. The data is becoming so voluminous that adding more human analysts is not going to solve the problem. And this issue is not slowing down. According to Nasa scientist Jer-Chyi Liou, “while there are currently about 1,400 operational satellites in Earth orbit, mega-constellations could increase that to as many as 7,000 to 8,000.” Just one small sat operator alone, Planet Labs, has currently 60 sats in orbit that generate 300,000 images per day = 1.6Tb per day.
Clearly, a different way of looking at change is needed
One solution is to use more intelligent technology to truly detect anomalies – by learning what’s normal and identifying when something seems different. In this case, normal can be an area that sees a certain type of change and is now not behaving as it should OR an area where there is normally not much happening but now sees some weird developments.
Artificial Intelligence that can analyze billions of pixels and look for anomalies in the data is what’s really needed. This is the needle in the haystack the analysts are looking for, and can not only reduce the needs for human eyeballs staring at image difference tools, but can also increase the accuracy of the results. By using AI in a “tip and queue” process, we don’t even need super high resolution imagery to begin spotting the anomalies.
Artificial Intelligence + Satellite Data
The Simularity Automated Image Anomaly Detection System (AI-ADS) is the result of extensive development at Simularity, where we have leveraged our cutting edge AI technology and experience with massive volumes of time series data, and applied these competiencies to satellite imagery. Our product uses AI and advanced image analysis techniques to learn what’s normal in a user’s area of interest, and detect anomalies in those areas when they happen.
Based on image analysis we have done, a wider resolution is perfect for spotting anomalies which can then be analyzed more deeply by the skilled analysts looking at higher resolution imagery – and only in the areas where they need to.
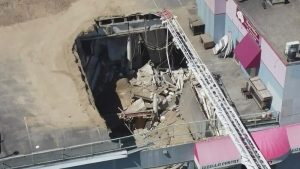
For example, here is an image from the Simularity AI-ADS which shows a new building appearing in an area, where there wasn’t a building before.

The same technology has been used to almost instantly spot fires, spills, and vehicles, in imagery that would take a human hours and even days to find. Now, by knowing where to look, the analyst can check if that building is correctly permitted, or if the vehicle is suspiciously parked where there normally isn’t one.
Simularity AI-ADS Available Now
Designed to run on a browser friendly platform, the Simularity AI-ADS can be operational in a data center or in the cloud – public or private. All that’s needed is access to specially geo-encoded image satellite data, such as the frequently updated images provided by Planet.com, a leading constellation satellite operator and image provider.
The Simularity AI-ADS features include:
- Graphical User Interface with map tiles and easy navigation, so you have your entire region at your fingertips
- Unlimited Areas of Interest (AOI) Management, so that geographical region efficiency can be optimized
- Multiple User support, to easily delegate responsiblities
- Alert Configuration – get notified when an anomaly occurs in your AOI
- Anomaly threshold setting per AOI, to handle different regional priorities
- Multiple data source support, so you’re not dependent on any one particular image provider
- Low cost capital investment, as the system supports a commodity hardware and O/S strategy and has a multiple node shared knowledge base
- Tip and Queue support, with image and coordinate output, for more detailed inspection of anomalies
- Image marking, in order to assist analysts in keeping track of what’s already been reviewed
Simularity is working with a select group of early adopter customers, to conduct pilot projects in their areas of interest and using their own or third-party sourced data. A limited number of pilot project slots are currently available.
For a private and confidential presentation, and live demo of the Simularity AI-ADS, please contact us today.