New: SAR-based Temporal Change Detection Reveals Important Changes Worldwide

How To Detect Changes From Space… Even  When There Are Clouds

NASA has collected data from several geostationary and polar orbiting satellites. that show the average percentage global cloud cover at any time is about 65 percent, making it hard to consistently monitor the Earth with optical satellite imagery alone.

For example, at our headquarters in Tampa, Florida, visibility from optical satellites is limited due to cloud cover about 50% of the time.

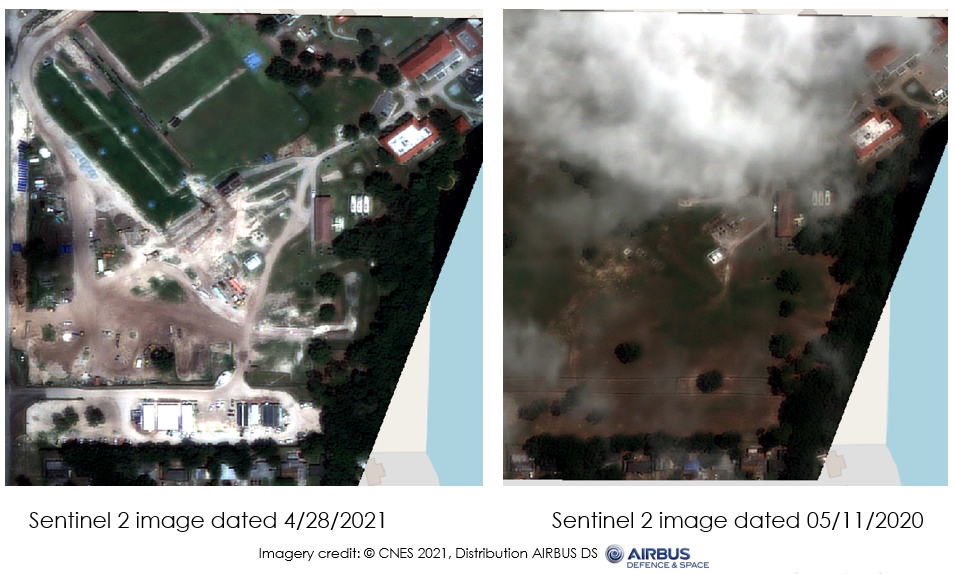
The requirements for 1) Daylight and 2) Cloud free images make it impossible to use optical images to consistently get clear views of most locations around the world.  Neither of these factors are limitations to getting clear views using Synthetic Aperture Radar (SAR).

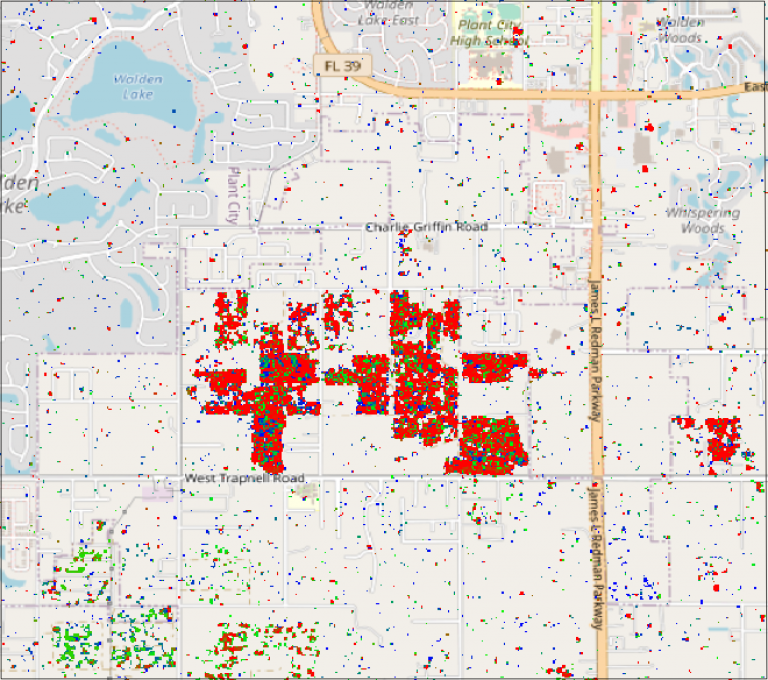
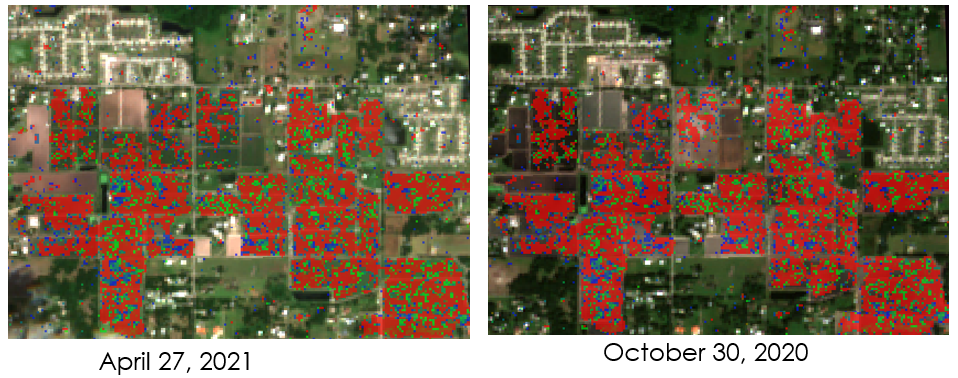
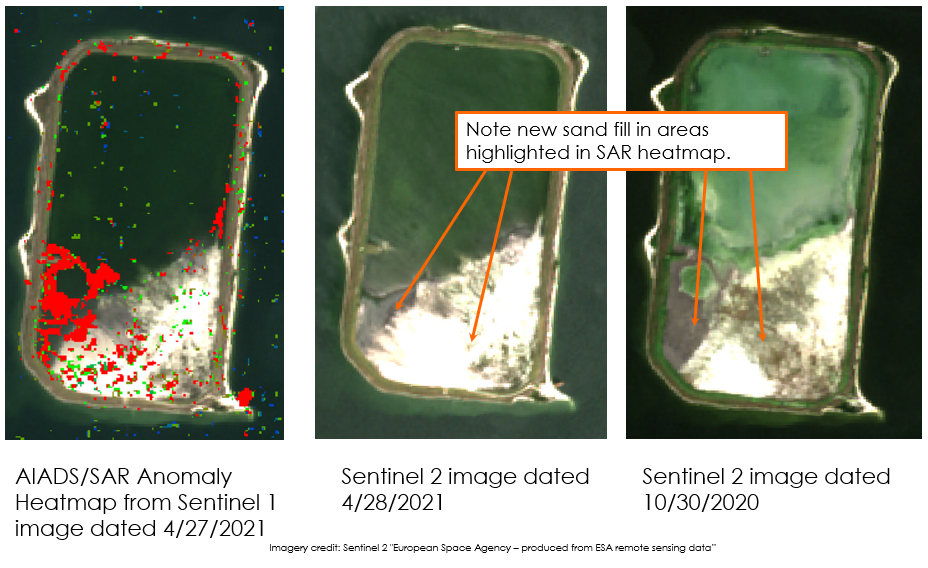
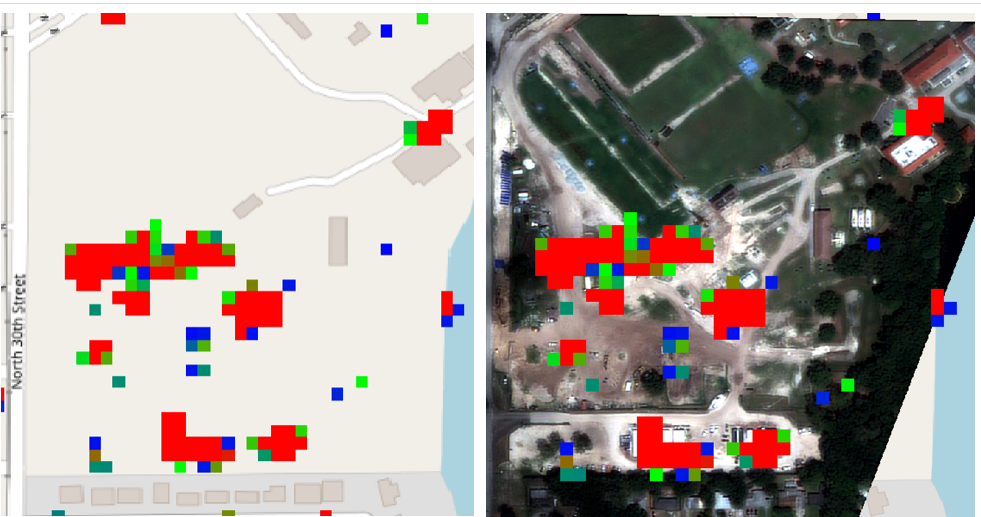
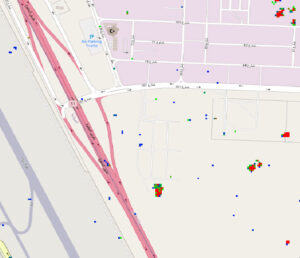
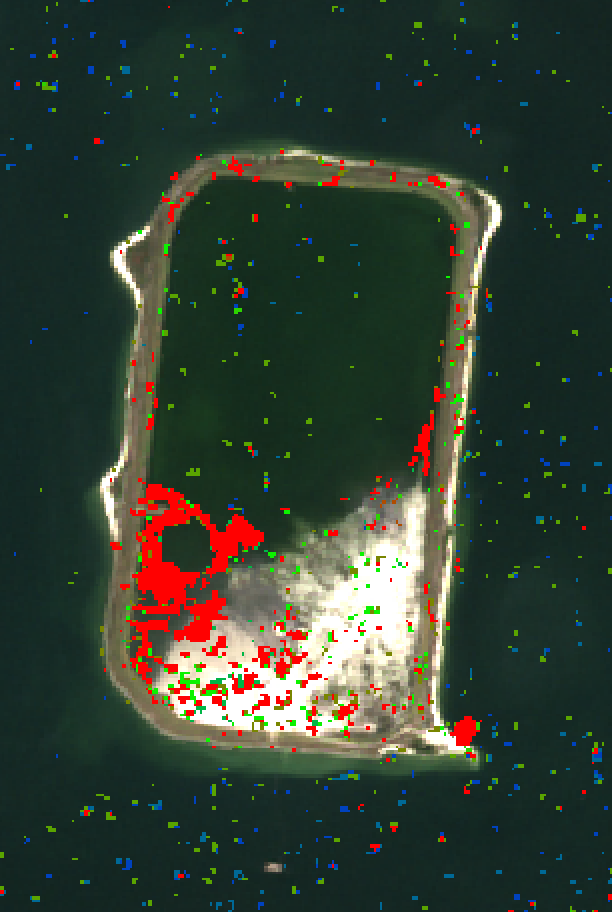
Simularity’s AIADS/SAR software finds unusual changes in shape and texture on the surface of the earth, from growth or destruction of vegetation and buildings, to the effects of a natural or man-made disaster. 

This is important for several reasons: 

  • In order to consistently monitor a location, you need a consistent way to “see” it.
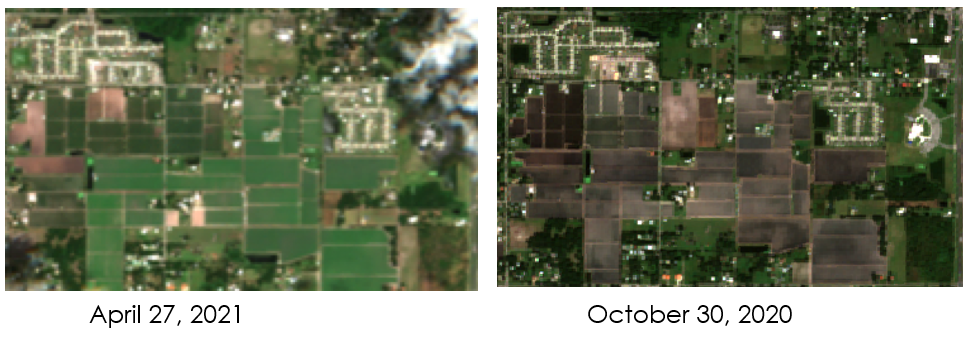
  • The usual metrics, such as NDVI, for crop health are dependent on cloud-free optical images, which are frequently difficult to get during the growing season.
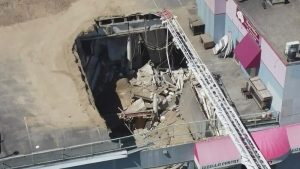
  • Both natural and man-made disasters, such as storms and fires, are obscured by clouds or smoke, making it difficult to assess the status of the situation and the damage caused.  alone 

Analysis of SAR Images Reveal What's Happening

SAR imagery can be taken through clouds and even at night, solving 2 challenges at once.

Simularity’s Automated Image Anomaly Detection System (AIADS) for Synthetic Aperture Radar (SAR) finds unusual changes in shape and texture over a period of time in a specified location.  AIADS/SAR uses a historical context of at least 4 prior SAR images of a location, plus a candidate image of the location (usually the most recent). 

The historical images help Simularity’s AI-based software understand the usual shapes and textures at a location, and how they normally vary over time.  It then highlights the unusual changes in the candidate image.

The following examples are taken from one SAR Anomaly image of the greater Tampa Bay Area in Florida.  They illustrate anomalies detected in SAR, and corresponding visual images to confirm the anomalies. 

These examples show Agricultural activity, Land reclamation, and Construction.

Detecting Agricultural Changes

Here’s an example of a recently produced Anomaly Heatmap, the result of our new Automatic Image Anomaly Detection System (AIADS) for SAR.

These images validate the SAR/AIADS results

Simularity’s AIADS/SAR detected change in agricultural activity in Plant City Florida between October 30, 2020 and April 27, 2021.

In these pictures you can see verdant fields in late April and fallow fields in late October.

Simularity’s AIADS/SAR Heatmap overlaid on the Sentinel 2 images below, demonstrates that that the areas of “vegetation change” that you can see visually in the previous slide are the ones identified by SAR on the anomaly heat map.

Detecting Changes in Land Reclamation


AIADS/SAR Land Reclamation Example

Tampa Port Authority Spoil Island

Location: 27.83118231, -82.43584672

The following example shows the power of using SAR imagery to detect changes in land reclamation, a process used to build additional land into water bodies.

Here we see the areas where sand was used to build up a coastal area of this island. The 2 optical images on the right point out the differences. The SAR-based anomaly image is shown on the left, overlaying a recent optical image to illustrate and validate the changes detected.

Detecting Changes in Construction

Simularity’s AIADS/SAR detected construction activity in Sulfer Springs, on the Hillsborough River, FL.

Here are 2 optical satellite images showing changes in construction. These relatively cloud free images aren’t always possible. In this case study we’re showing them to confirm that our SAR-based anomaly detection can find the changes – even if there are clouds or if it’s night time.

The following image contains our AI-generated anomaly heatmap which was based on SAR imagery from September 11, 2020  through April 28, 2021, overlaid on the optical images, to confirm that we identified the changes.  Due to clouds, the only optical image we could find where this site was visible before 4/28/21 was almost a year earlier, on May 11, 2020.  The construction changes that are not marked as anomalies are almost certainly those that occurred between May and September 2020.  This illustrates the problems with identifying major persistent changes like construction with optical imagery alone.

Simularity is now accepting enquiries from customers who wish to monitor specific areas of interest – anywhere in the world – using our SAR-based Anomaly Detection report service.

When combined, Simularity’s AIADS for Optical Imagery and AIADS for SAR give a more complete view of what is happening at a location.

Contact us for a chat about how we can help you with your monitoring needs.

Simularity

Simularity