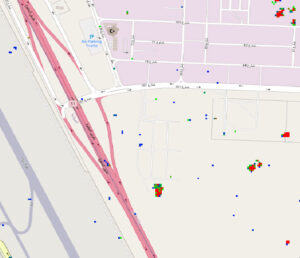
Analysis of satellite images is nothing new. Governments have used it to monitor other countries for decades. Hedge funds started to innovate by using satellite imagery to count cars in company parking lots to predict sales 15 years ago. But until recently, from a technology perspective, limited imagery, and the highly manual process of image analysis has limited satellite image analysis from reaching its full potential.
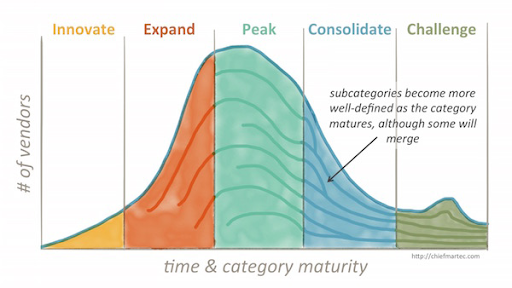
We have crossed a major step: from Innovate to Expand. The following 3 indicators signal that the satellite image analysis industry has changed from Innovation to Expansion.
One: Investments
Investors have been increasing their stakes in space ventures. This graph looks similar to the Expansion curve above. The result is a vast increase in the amount and quality of satellite imagery data available now.
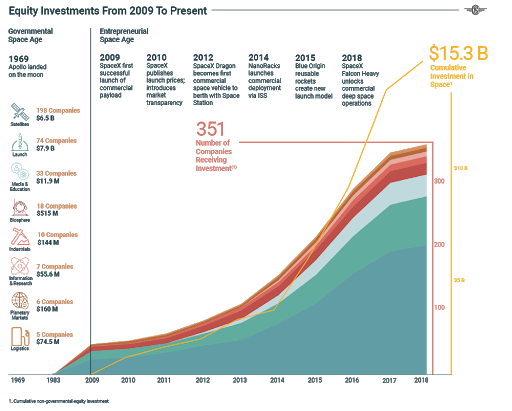
Furthermore, they have started investing in startups that automatically process satellite images, in addition to companies that launch and own satellites. Brandon Farwell with Valley Voices/Forbes clearly shares this point in his article “How To Win Big Investing In The Space 2.0 Boom” with an VC insider view.
There is a clear growing trend in the CB insight chart below – Earth Observation (EO) and Machine Learning (ML), which shows the large investment in geospatial analysis companies.
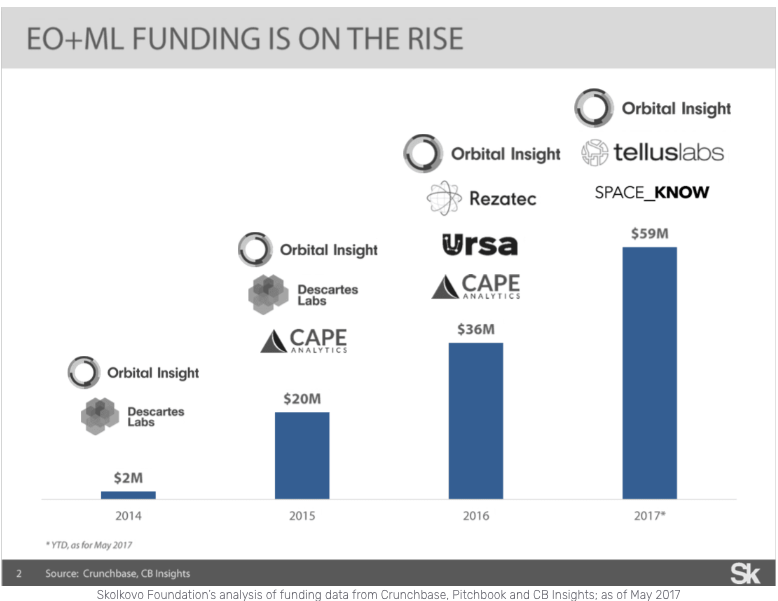
Investors are seeing growth beyond hardware and infrastructure to sophisticated automated analysis applications. This is a typical evolution when an industry starts to mature and it is no different for this industry.
Two: Increasing Software Sophistication
Robert Cardillo, former Director at NGA recently said “I envision the future where we will move from analyzing Big Data towards realizing a potential of Fast Data. We’ll buy basic imagery analysis as a commodity – much like we buy foundation data today”.
Cardillo is not the only one: A recently released industry report by Northern Sky Research, Satellite-based Earth Observation (EO), 9th Edition, forecasts annual revenues from satellite-based Big Data analytics for EO to reach $1.3 billion by 2026. This a 5x faster growth rate than the rest of the EO industry.
Software for analysis of satellite imagery has evolved from software that shows, stores, and annotates the data, to software with embedded artificial intelligence (AI) that delivers on the Fast Data promise: automating time consuming tasks, greatly increasing the capabilities of satellite image analysts, processing more imagery, increasing analysis accuracy, and delivering new use cases.
Three: Merging Of Data Sets And The Need For Automated Data Preparation
In the past, there was a lot of manual work required to include imagery from different providers and with different attributes, in the same analysis. Today, the latest automated image analysis software can combine different data sets from different providers, including attributes such as different resolutions, different coordinate systems, and different multispectral bands.
Software can even combine optical and SAR imagery using artificial neural networks. Artificial intelligence can be used to create unique cutting edge automated analysis such as detecting illegal camping in the middle of a forest, or finding garbage in the ocean. The use of different sources of data combined with AI analysis delivers the level of accuracy required to give stakeholders confidence in the analysis.
Simularity recently developed the ability to combine and analyze different satellite optical and SAR data sets from different providers, with varying attributes. The different data sets are automatically pre-processed and then analyzed with AI so that more timely, accurate, and relevant insights can be delivered to image analysts, greatly improving their productivity.
The process of combining differing datasets for a single analysis typically involves these activities:
Translate all imagery into a consistent coordinate system
Atmospheric correction
Dynamic Range Adjustment
Dividing images into tiles and syncing the tiles across the data sets
Parallel analysis of tiles (for analyzing large amounts of imagery quickly)
Develop co-registration transforms for each tile in the analysis set
Training artificial neural networks (ANNs) to recognize objects or patterns of interest
Running trained ANNs over the combined data to recognize objects or patterns
Applying an expert system to derive insights from the results
Creating a GeoJSON file with the analysis results
In Conclusion
These 3 major changes show that the satellite image analysis industry has shifted into a more automated, big data phase. The increasing amount and cadence of satellite imagery, the need to combine data from various sources, the growth in the sophistication of analytic algorithms, and their applicability to specific use cases, is driving major expansion in the industry. We believe these factors will push the satellite image analysis industry into a new best of breed approach vs. the status quo single vendor integrated solutions, and open the door to more project-based, mash-up style solutions.