Shining A Light On Illicit Activities
Trying to hide your illicit activities by doing them at night? Not any more – AI+SAR+Optical can be trained to track activity at night. Trying to hide your illicit activities under the canopy of trees? Not any more. AI+SAR+Optical can be trained to see the texture and health of the tree canopy, and the ground underneath, noting changes that come with human activity.
Optical satellite imagery allows us to see various bands of the electromagnetic spectrum, including visible light, and invisible light (such as infrared). SAR allows us to “see” through clouds and darkness. Since SAR tells us about the texture of the earth’s surface in conditions where there is no illumination, we can get details about what is going on in the dark, and on cloudy days. Artificial Intelligence (AI) algorithms can be trained by example to recognize features in an optical image in a corresponding SAR image.
Tracking Activity In The Rainy Season
We can get occasional optical pictures when there aren’t clouds, but in the rainy season, months can go by with no optical view of the earth in tropical locations. To get a better idea of human activities during the rainy season, we can use optical imagery examples of various activities to train an AI to recognize these same activities in a SAR image.
The combination of these technologies is a powerful tool in the earth observation toolbox. It can be used to add value for diverse industries. A brief introduction of SAR follows, with examples of other use cases that can be addressed with AI+SAR+Optical.

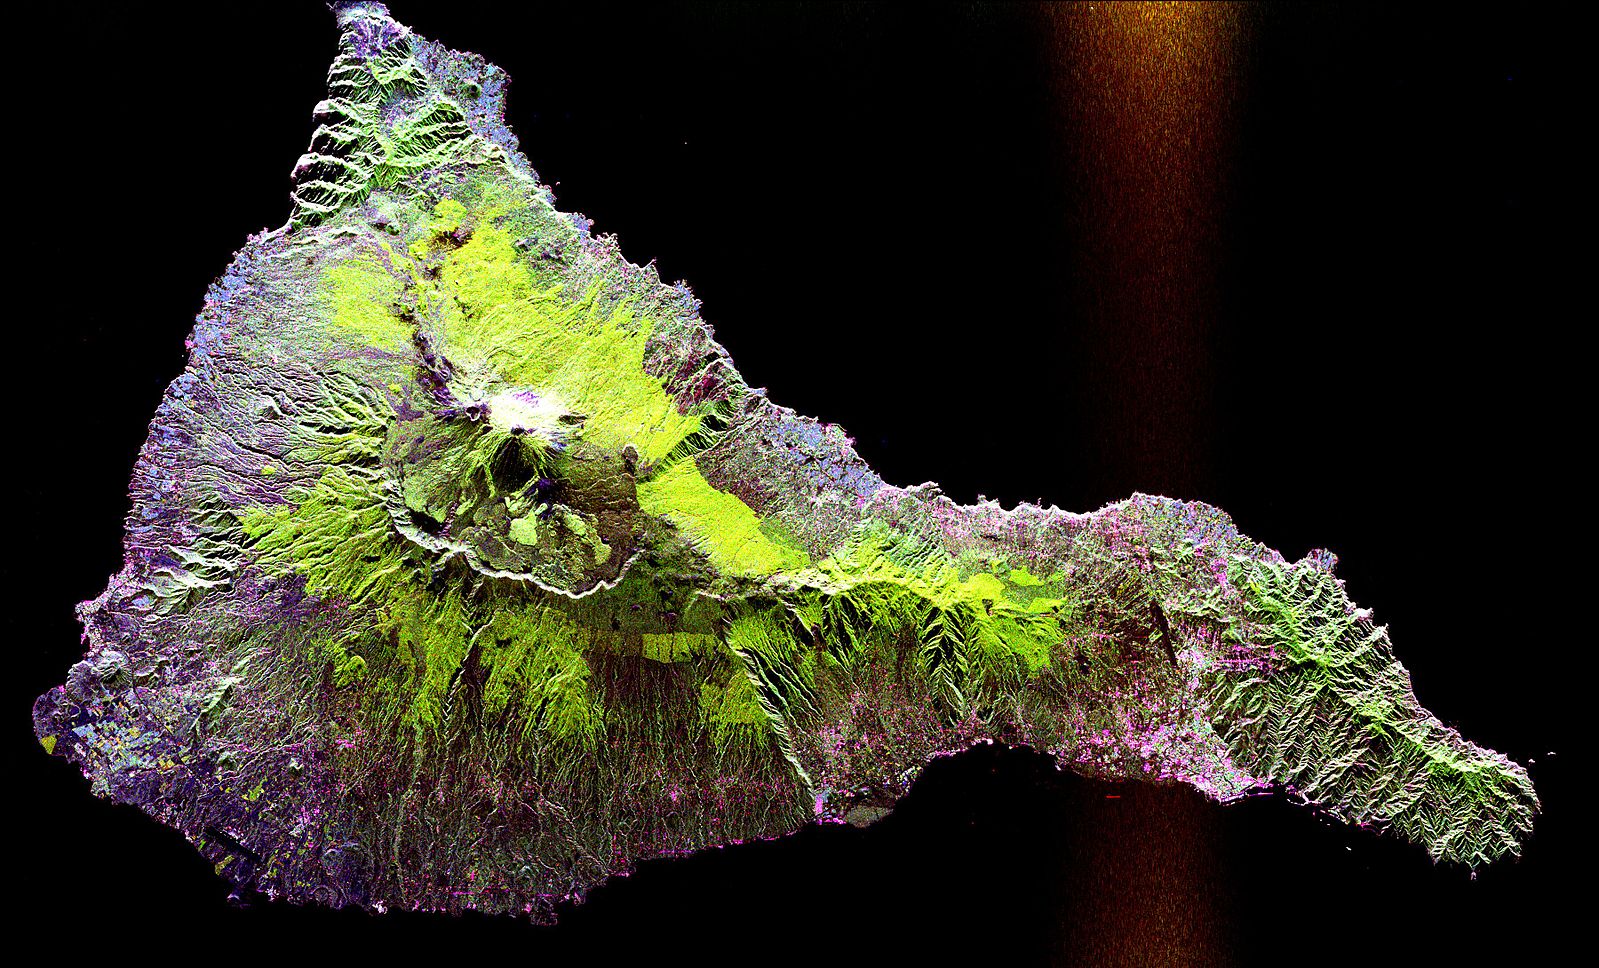
Image source: https://commons.wikimedia.org/w/index.php?curid=117320
This radar image acquired by the SIR-C/X-SAR radar on board the Space Shuttle Endeavour shows the Teide volcano. The city of Santa Cruz de Tenerife is visible as the purple and white area on the lower right edge of the island. Lava flows at the summit crater appear in shades of green and brown, while vegetation zones appear as areas of purple, green and yellow on the volcano’s flanks.
SAR: How does it work?
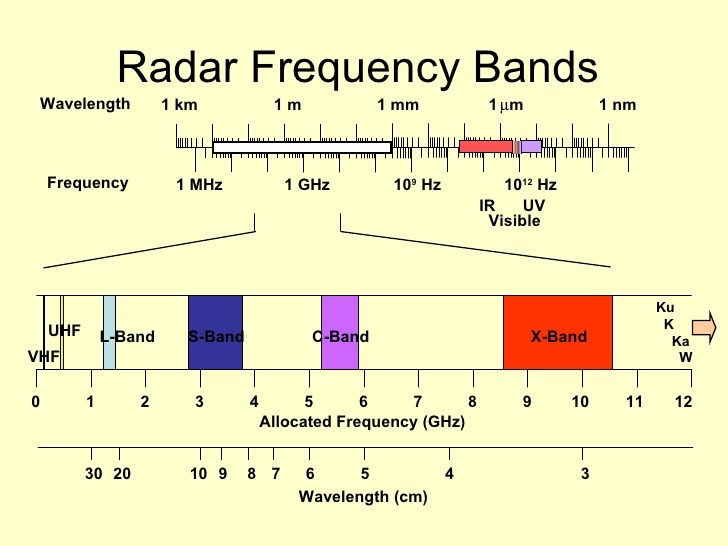
SAR stands for Synthetic-Aperture Radar and is a form of radar. Radar waves are part of the electromagnetic spectrum. The length of the radar waves used for SAR can be measured in centimeters, which are far bigger than the lengths of the waves in the visible spectrum. SAR uses the frequencies in the microwave bands that can penetrate the atmosphere. These waves can bounce off the surface of the earth, helping us see things in the dark or that are covered by clouds.
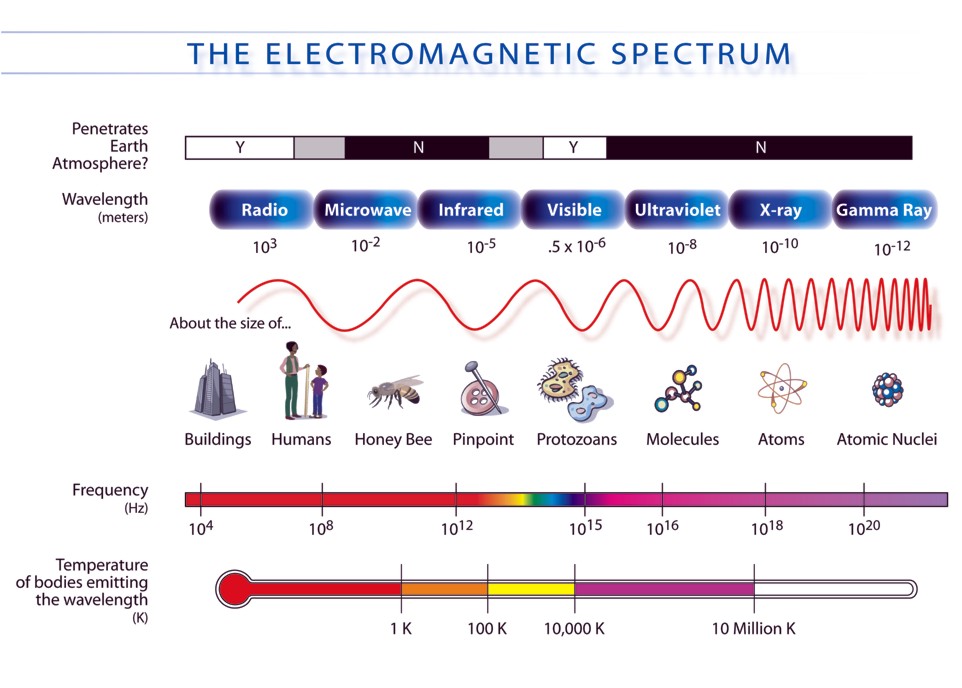
- Image credit: https://www.ilibrarian.net/science/electromagnetic_spectrum.jpg
SAR is an elegant innovation invented in 1951 that leverages the motion of the radar which is mounted on a satellite/plane to create the equivalent of a large radar antenna. This “antenna” is placed over a target / region to provide fine spatial resolution.
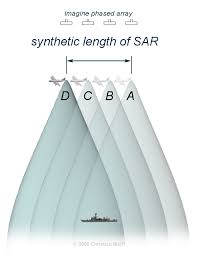
- image source: www.radartutorial.eu
The distance the SAR radar travels over a boat, for instance as in the image above, in the time taken for the radar pulses to return to the antenna creates the large size of the antenna ( i,e synthetic antenna).
Typically, the larger the synthetic antenna (or aperture), the higher the image resolution will be. As a result, SAR can create high-resolution images with small physical antennas which are mounted on a satellite or plane.
Signal processing is used to process the different radar echoes and combine them for the different positions to create high resolution images. As an example, the resolution of SAR data coming from the Sentinel Satellites can be a high as 2m x 5 m.
How does SAR see through clouds, smoke, fog, and darkness?
Optical imaging relies on light from the sun for illumination. This is called “passive” imaging because the satellite is not providing the illumination source. The obvious downside is that if the sun isn’t shining on what you want to see, or it is covered by clouds, you’re out of luck.
SAR is an active imaging process that beams microwaves down to Earth. These invisible waves “illuminate” objects by bouncing off of them. Some of those “echos” bounce back to the satellite, where data on the polarization and intensity of the “backscatter” is captured.
Because microwaves with certain frequencies, L-Band, C-Band, and X-Band, can penetrate haze, light rain and snow, clouds, smoke, and darkness, these waves are good for viewing the Earth from space. These are the frequencies used in SAR:
The mechanism is similar to the use of ultrasound to see inside our bodies: a wave (longitudinal sound waves in the case of ultrasound, electromagnetic waves in the case of RADAR) is sent towards the object to be viewed. We are able to “view” the object by looking at the differences in how the wave is reflected back.
In the image below, a radar wave is sent out from the satellite, and bounces off the surface of the earth. Not all of the scattered bounces make it back to the satellite antenna: some are absorbed (for example water absorbs much of the radar wave, and so water appears black in SAR images), and some bounce away in other directions.
The degree to which the antenna picks up the bounced waves is dependent upon the surface characteristics of the objects being observed. The greater the percentage of waves that return to the antenna, the higher the intensity. Objects can be identified by patterns in these intensities, and in we can get different views of the backscatter by measuring intensities of the polarity of the beams sent out (horizontal or vertical)and the polarity of the beams that bounce back (horizontal or vertical). This makes SAR an excellent tool to learn more about the surface of the earth than we can with just optical imagery.
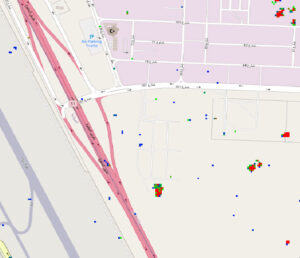
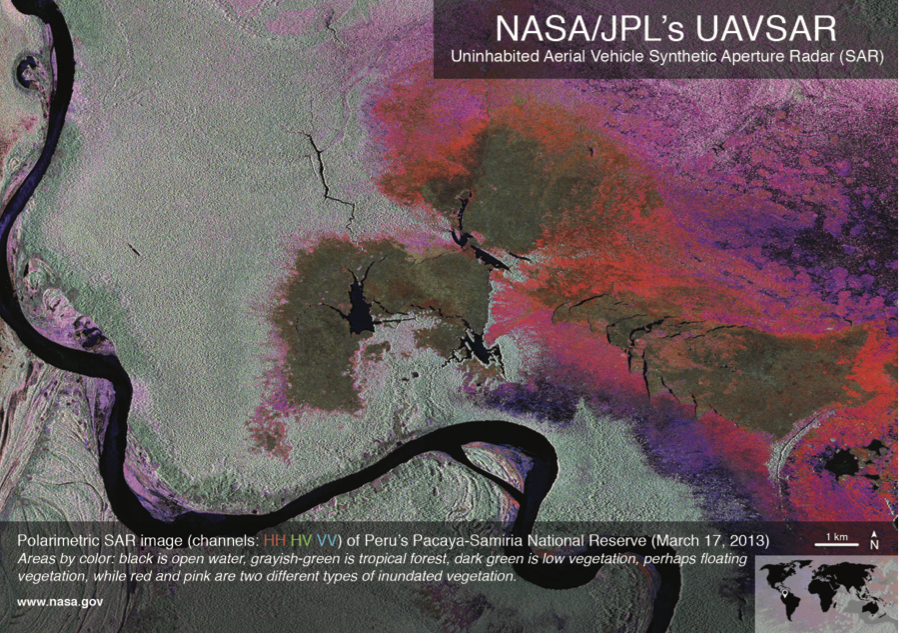
Raw SAR imagery is black and white because it contains measures of intensity of backscatter, and these radio waves are not colored because they are not in the visible spectrum. However, we can create “false color” images, such as the one below, by assigning different polarizations to the RGB color channels. HH indicates horizontal polarization sent out, and measure of horizontal polarization returned. HV indicates horizontal polarization sent out, and measure of vertical polarization returned. VV indicates vertical polarization sent out, and measure of vertical polarization returned.
In the image below, HH is mapped to red, HV is mapped to green and VV is mapped to blue. The resulting colors can indicate features of the surface being viewed, in this case, the amount of water in the vegetative areas.
AI+SAR+Optical Use Cases
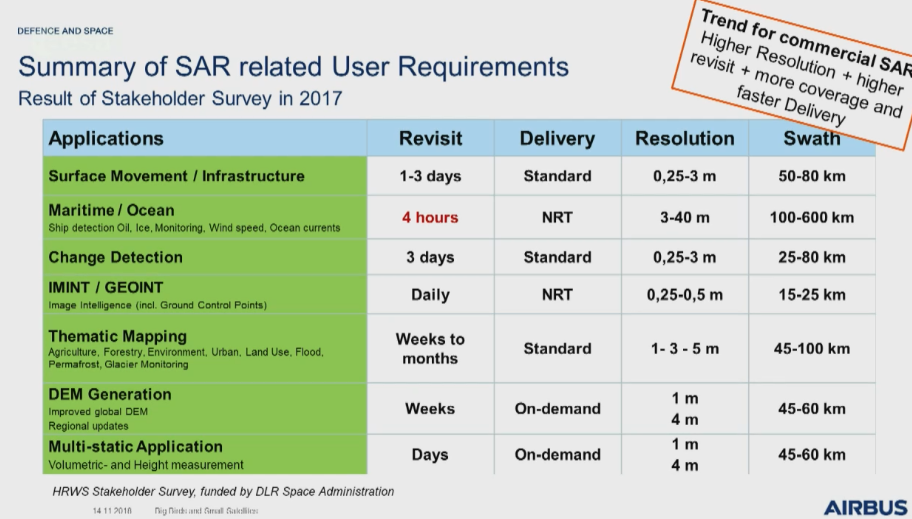
Airbus sees applications of SAR across all the major industries:
Crop Insurance Claims
Typically for crop insurance claims, the process is laborious and hence cost intensive. The process requires repeatable results for loss estimation and this very hard to achieve. This is where AI+SAR+Optical can identify areas within the plots with different significant change before and after the event. This analysis is provided to the loss adjuster so the relevant spots can be inspected. Furthermore, the data can also be aggregated to calculate the loss ratio per area. Allianz, a large insurance company has already implemented this solution.
Crop Health In Cloudy Regions
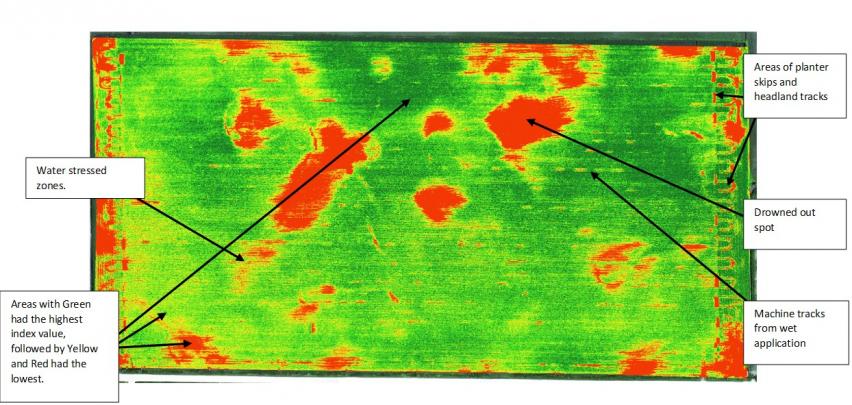
The part of the electromagnetic spectrum that is visible light is quite small relative to the whole. Near infrared (NIR) and shortwave infrared (SWIR) light, also sourced from the sun, can be used to “see” things that aren’t obvious in the visible spectrum. For example NIR can be used to determine how healthy plants are based on photosynthesis. The Normalized Difference Vegetative Index (NDVI) is a commonly used index based on optical data that assesses crop vigor based on a mathematical interpretation of visible color and near infrared data. Below is an example of the NDVI index and assessment of crop health.
This article by Scott Soenen, Agriculture Monitoring with SAR at Scale, goes into interesting detail on using multi-frequency SAR for crop analysis, and compares SAR to the optical index (NDVI) for monitoring crop health. The SAR data is correlated with NDVI and provides additional insights. This makes combining AI+SAR+Optical a powerful tool for agriculture:
“the SAR data is providing some information on the structure of the vegetation that is correlated with what we can derive from optical data, and it’s certainly better to have this information from SAR than no information at all when there is cloud obscuring optical observations. This is especially true in agriculture areas with frequent cloud cover.”
Accurate deforestation monitoring in tropical regions
Most tropical regions are cloudy most of the year. As such tracking deforestation with optical satellite imagery typically fails as cloud-less imagery is too infrequent.
AI+SAR+Optical is ideal to solve such a use case because it sees through clouds and can even provide data to measure the forest density, and how the health of the forest has changed. Researchers have demonstrated this use case for deforestation monitoring in Bolivia.
Building inventory for cities
Most urban cities do not have an exact inventory of the buildings. Typically, the inventory was done manually for many years which makes sharing information across departments very difficult.
Because SAR measures backscatter (which identifies the surfaces of objects), it can be used to derive the height of a object it is observing. The university of Buffalo demonstrated that using SAR data and analytics could automate creating or maintaining the inventory of buildings in an urban city.This includes recording the footprint, height and shape. Several cities in the US are now considering using this approach to digitize their inventory process and cut cost.
AI+SAR+Optical can do a great job of this because it can be trained to recognize objects like roads and buildings in both SAR and Optical data, creating a more complete view of the urban landscape.
Fire monitoring
SAR data is especially helpful when monitoring smokey situations such as fires and volcanoes. Damage done by fires and natural disasters can also be assessed using SAR.
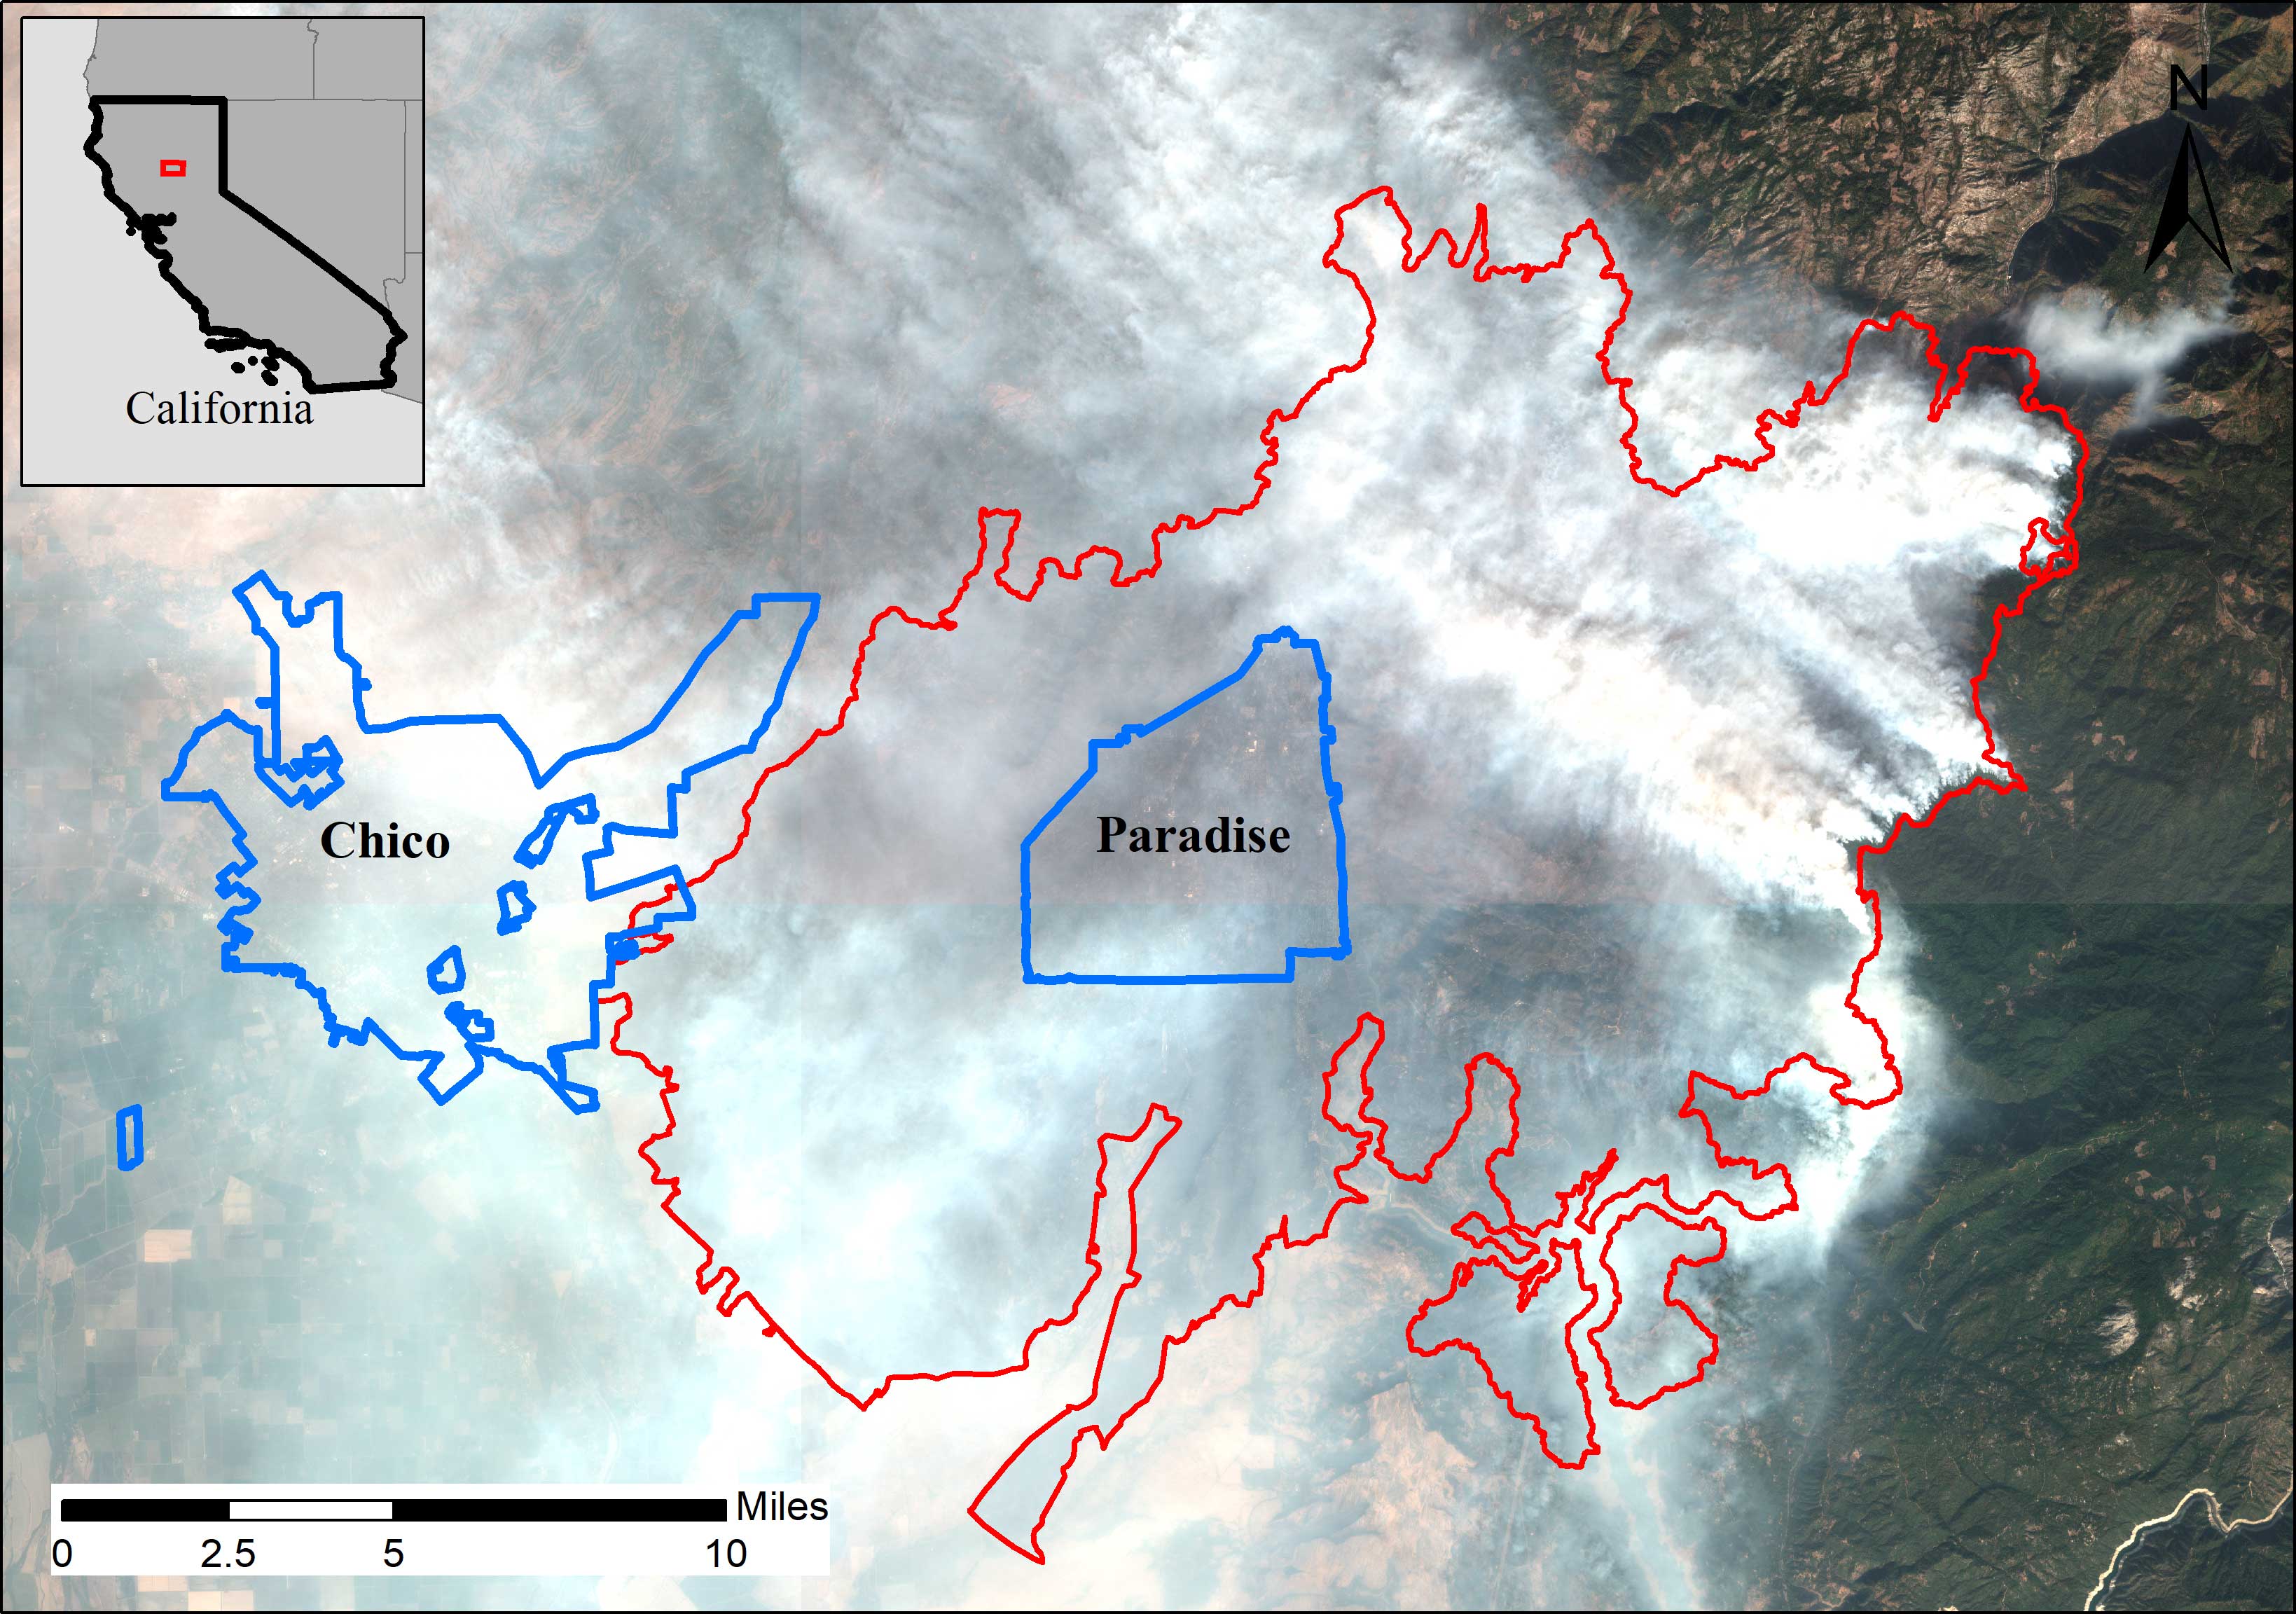
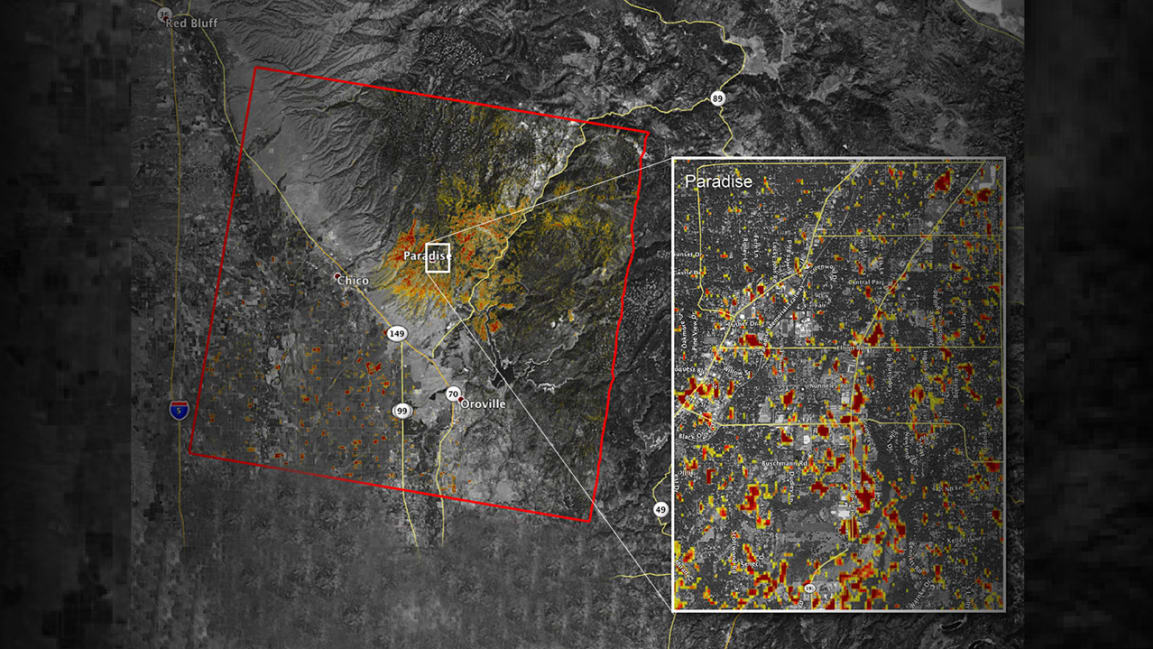
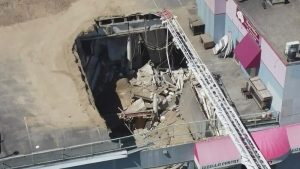
This is a SAR image of the same area, provided by ESA’s Sentinel-1 SAR, which gives a much clearer view of the damage done by California’s 2018 Camp Fire. Here are more details on Fire Monitoring studies from PlanetWatchers.
Land Deformation, Erosion, and the Ocean Surface
Researchers can detect land movement down to centimeters by comparing two or more SAR images of the same location over time, a technique known as interferometric SAR, or InSAR.
Depending on the antenna configuration, InSAR can be used to measure surface topography; ocean wave topography, wind direction, and currents; ground moisture changes, surface deformation (from glaciers, earthquakes, volcanoes, etc.) and gradual changes like erosion.
Here is how it works: any movement of the ground surface toward or away from the satellite can be measured and illustrated in a picture where different colors indicate different sizes of changes.
credit: ESA/NASA/JPL-Caltech and djxatlanta
This is another use case where AI+SAR+optical can be a powerful solution: we can use time series analysis to determine how the earth is deforming over time and predict future deformation that could lead to human disasters, such as mines collapsing.
Anomaly Detection
SAR can detect minor changes in elevation of objects. However, there are many objects in the world that regularly change their altitude: tidal flows, vegetation, even some man made objects change altitude.
With AI+SAR+Optical, we can filter out the normal changes and identify the unusual ones – the anomalous changes that are of interest, helping analysts save hours of time finding what they are looking for.
At Simularity.com, we use AI+SAR+Optical to find things and monitor changes… even when the sun isn’t shining,