In this blog post we’ll demonstrate how relatively low cost and low resolution SAR imagery can help governments and other organizations monitor wide areas so that they can be alerted to significant events.
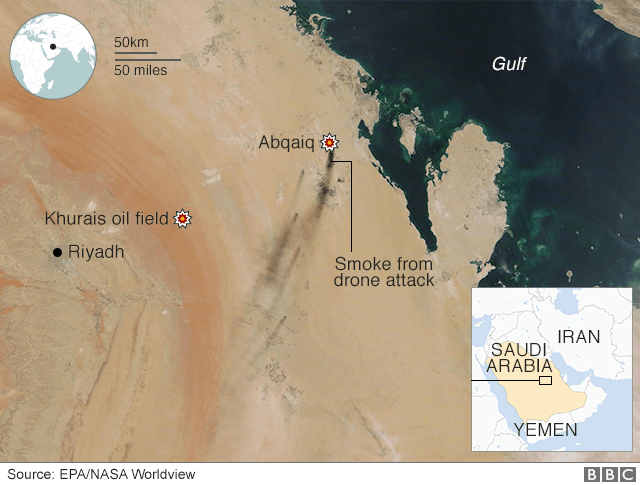
On September 14, 2019, at approximately 4am local time in Eastern Saudi Arabia, a group of precise drone strikes attacked these oil storage and processing facilities at Khurais and Abqaiq. Reference: BBC article
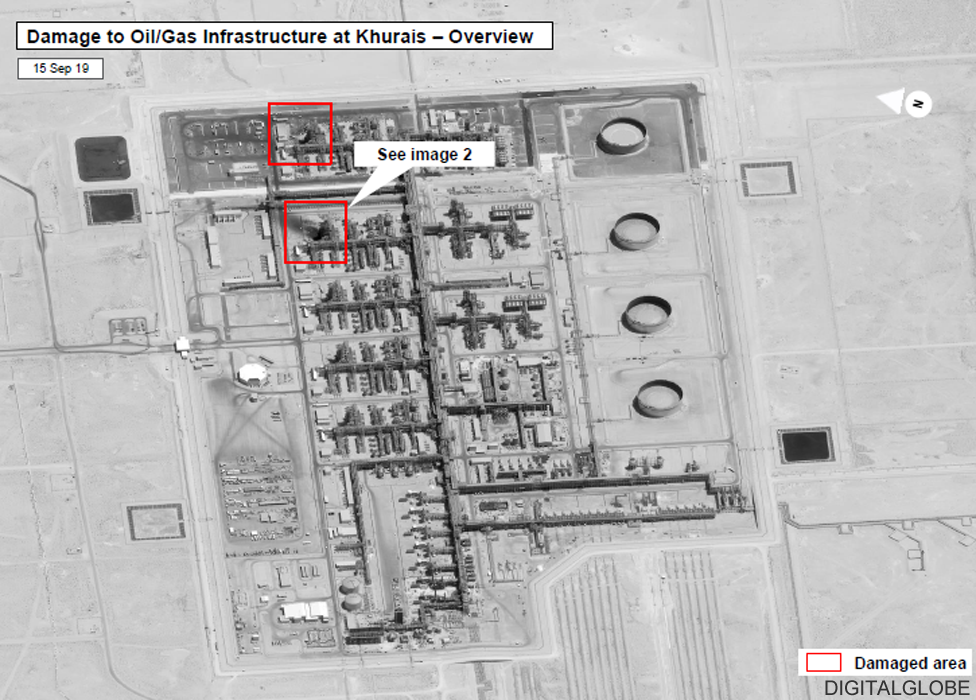
The Khurais facility was damaged mainly at its NE corner, as shown in this DigitalGlobe image taken the next day September 15, 2019:
Simularity’s Automated Image Anomaly Detection System (AIADS) detected anomalies caused by the attack. First we used our new AIADS/SAR module on free Sentinel 1 imagery to detect anomalies from changes in structure and other physical changes. Then we used AIADS on Pleiades optical imagery to help complete the damage assessment.
First we ran our proprietary AIADS/SAR (currently a private custom block) on UP42 , using high cadence tiled Sentinel-1 SAR images which are available in the UP42 marketplace thanks to their partnership with Sobloo. Luckily there was a pass overhead just 14 hours after the attack, so we had “ground truth,” in terms of timeframe and location, for the attacked facility.
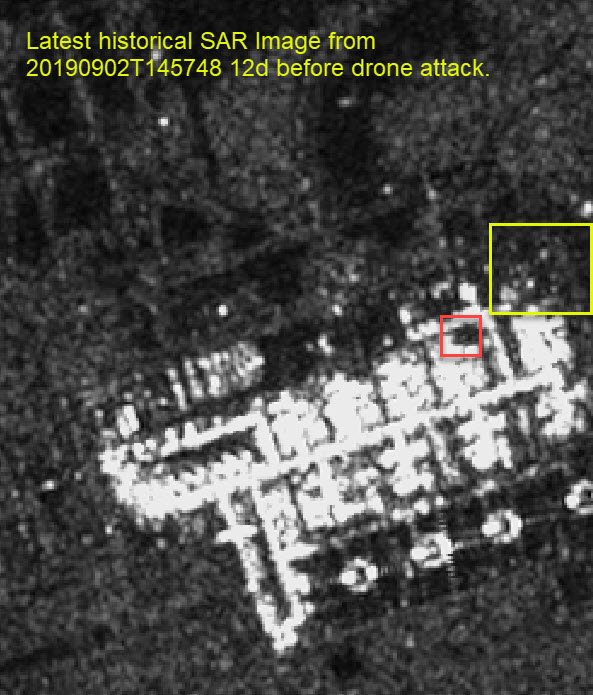
Here is a “normal” image of the facility taken by the Sentinel-1A bird approximately 2 weeks before the attack. The yellow box is where the facility sustained damage and is also near a parking zone where heavy equipment vehicles and large repair parts were delivered. The red box indicates a second attack site where a large fire occurred. This is the “before” view of these areas.
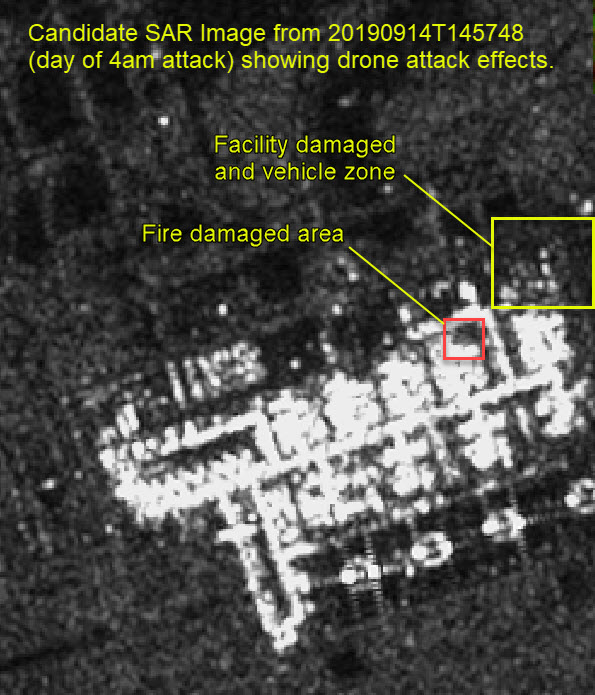
Below is a cropped SAR image of the facility taken that day, with some visible changes in the area that was hit (yellow box) and invisible (to SAR) changes where a large fire occurred (red box). This is the “after” view of these areas.
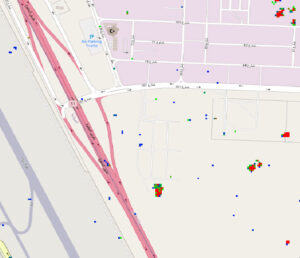
Using temporal analysis on multiple historical SAR images from the S1A bird, we used AIADS/SAR to produce this anomaly “hotspot” image showing the major changes of interest – especially in the damage zone of the Khurais infrastructure. Note that AIADS uses red to indicate areas of the most unusual temporal variation followed by green, then, blue, and finally transparent for no significant change.
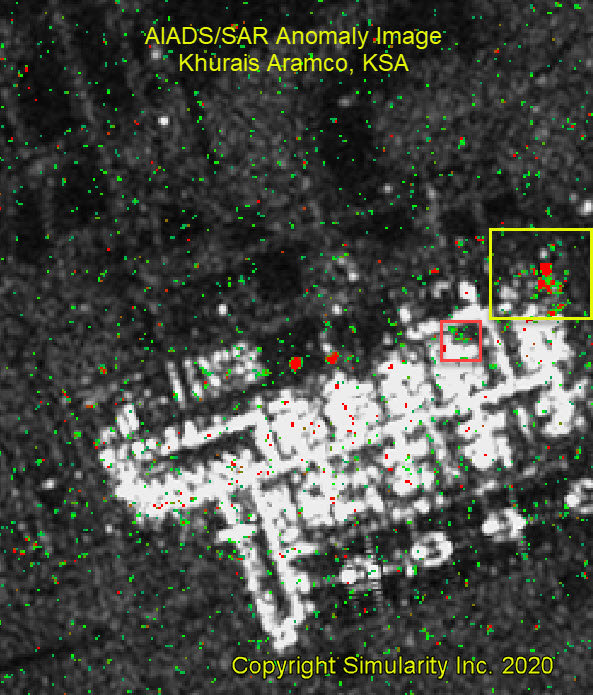
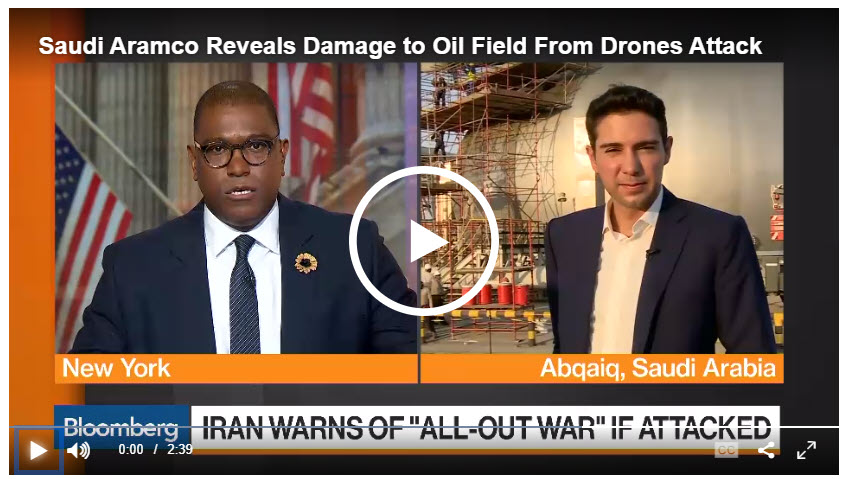
The yellow box shows significant changes, which we know to be damage from the drone, as well as heavy equipment and vehicles/cranes in the parking lot, which were present shortly after the attack that day. The sudden repair and construction activity in this area is most likely much like what was happening at the same time at the Abqaiq facility, as reported in this video below (c/o Bloomberg). Note that AIADS/SAR also found other valid, significant anomalies at the site, indicated in red.
The scorched area (red box) did not get detected very strongly by AIADS/SAR, which is understandable due to SAR being more sensitive to physical changes (changes in shape and reflectivity) vs. optical changes in the pixels. Read on to discover how AIADS did detect the scorched ground when optical satellite images were analyzed.
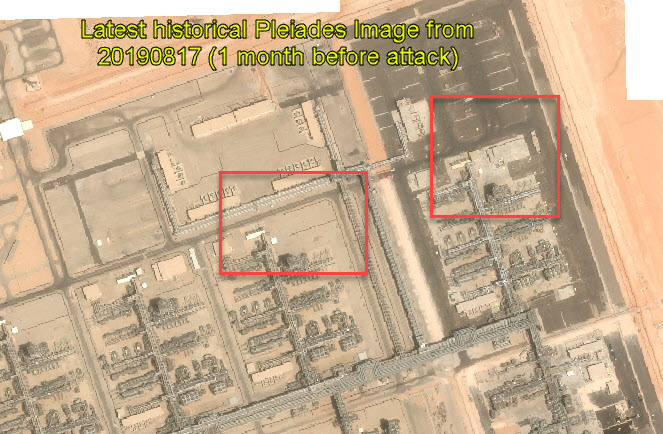
To get a more complete picture of the damage, we then used AIADS to analyze optical imagery. We selected Airbus’ Pleiades Streaming tiled imagery on UP42 and used AIADS on 5 historical images plus one candidate image from soon after the attack, on September 17, 2019 – just 3 days after the strike.
Here is the most recent historical image of the facility under “normal operation” taken on August 17, 2019. Note the fairly empty NE corner parking lot and clean pavement in the left red box.
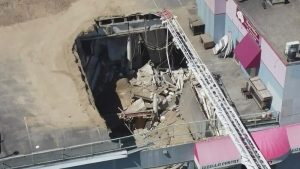
Here is the damaged area just 3 days after the attack. The images are similar to the DigitalGlobe image from the BBC article. The scorched area is clearly shown and the drone struck tower next to it (right hand red box) has some reddish chemical spilled on the top pipes and there are clearly some vehicles and other related equipment that are there to repair the damage.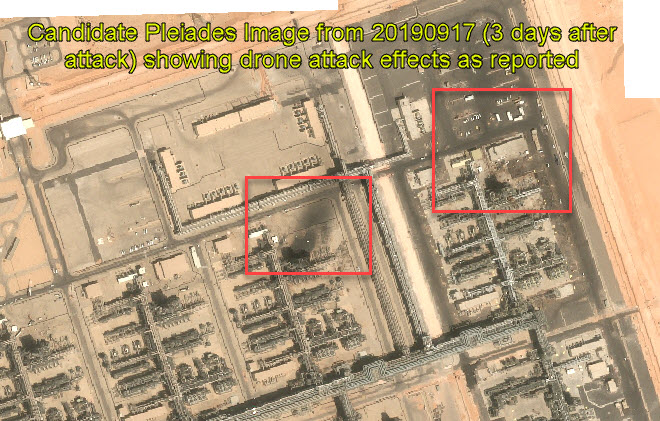
We ran AIADS (including our Coreg algorithm) on the 5 historicals plus the above candidate image, and here is the anomaly image produced. Note that in our configuration we use red to have AIADS identify areas of the most unusual temporal variation followed by green, blue, and transparent for no change. Note that the other red areas also indicate significant anomalies: in this case it appears to be new paving in those areas.
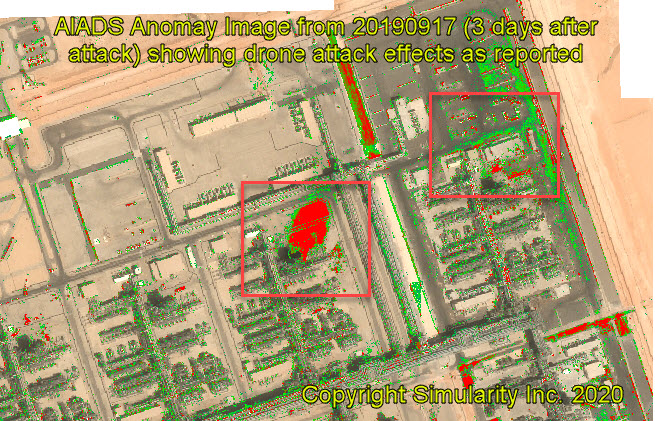
The optical-anomaly image above confirms that the scorching/fire damage can be easily detected by AIADS and also the vehicles in the right hand box. Some speckling has been picked up as well, in the damaged reddish pipe however we don’t have exact confirmation where the damage was. The scorched area was not detected by the SAR analytics, as explained earlier. However, with the added perspective provided by this optical anomaly image, we get more information about what happened. This is verified by the international reporting on the attack.
SAR and Optical imagery can tell two different parts of the larger story. It is clear from this case study that it’s best to use data from multiple sources, when trying to detect a “situation”. AIADS and AIADS/SAR can be combined to automate the detection of significant changes to get a more complete picture of what happened, and to do it quickly.
With high resolution satellite imagery, the cost of the imagery can make it expensive to monitor wide areas – even if the investment in the analytics is relatively less. However, as demonstrated in this case study, using AIADS and AIADS/SAR to automate monitoring of areas using free imagery is fast, cost efficient, and effective.
In the case of using low cost, low resolution, high cadence SAR imagery, such as Sentinel-1, there is a very high “return on data,” as we can find major changes (and alert on them) in a fully automated process. The only real cost is that of the analytics run, and not the imagery itself or the man power to analyze the imagery by hand.
We recommend a combined approach for monitoring large areas: use free or low cost SAR and other low resolution/high cadence imagery to detect unusual changes and then use smaller, high resolution AOI/tiled optical and SAR imagery with higher resolution to get additional answers in order to complete the story.
While this case study focuses on monitoring destruction, AIADS can also be used to monitor changes in economic activity. As economies around the world rebound in the wake of the covid-19 pandemic, identifying and quantifying the recovery of economies is taking center stage. Automated, cost-effective, and accurate analysis is essential to track progress or lack thereof. Use of high cadence imagery offers near real-time insights. Ask us for a demonstration.
This case study illustrates the value AIADS and AIADS/SAR can add to your monitoring tasks. AIADS is available on the UP42 Platform, and directly from Simularity. AIADS/SAR is launching soon on UP42, and is available directly from Simularity. Contact us today to find out how we can help improve the accuracy and reduce the costs of all your monitoring.
Pleiades Imagery credit: © CNES (2019), Distribution AIRBUS DS