Can AI and Satellite Imagery Detect the End of Covid-19?

Many states in the US are under “shelter in place” guidelines and as a result, most businesses are closed.


The most talked about economic topic on most financial networks is will we see a V, U or L shape recovery when the shelter in place guidelines are lifted?


No clear consensus has emerged yet because the economic damage of Covid-19 is broad, unprecedented and still a fluctuating status.


At Simularity, we use AI to identify potential leading indicators of recovery and thus can track the velocity of such recovery once it happens. Here’s an example of such indicators for the airline rental car industry that we were able to discover using AIADS from Simularity.


Below you will see a satellite view of San Francisco airport in Northern California with a focus on the long term parking and car rental facility.


Below, we can easily see the SFO long term parking sections in blue and car rental facilities. This satellite picture is dated from March 4th, 2020: 2 weeks before the shelter in place guideline was implemented.


Note how the long term parking lots (in blue) are quite full. The car rental facilities (green) have some available cars as seen by the cars parked on their lot. 

Using AIADS, we were able to automatically analyse the changes post shelter in place guidelines.


We used AIADS to analyse satellite images over time, pre and post shelter in place. The AI can train on a small set of historical data and is thus well adapted to handle this type of analysis.


The red overlay (AIADS anomaly output) indicates the significant changes and a few leading indicators appear on a satellite image dated from April 1st.

Note the orange arrows, The rental car facility is now full of unrented cars.


This is such an unprecedented time that the rental car companies had to store the cars on the top of the long term parking as shown with the green arrow. The AI was able to discover the storage of rental cars on the rooftop of the long term parking building.


It is likely that once business start to pick up again and car are rented, they will first pull the cars from the long term parking rooftop storage and this is a great leading indicator of economic recovery starting.


The other obvious indicator is the long term parking lot being completely empty.


We can see below the progression on the following day, March 3rd, March 11th and April 1st as the lot emptied progressively. Tracking cars parked in the long term parking lot will be another leading indicator of travel business recovery.


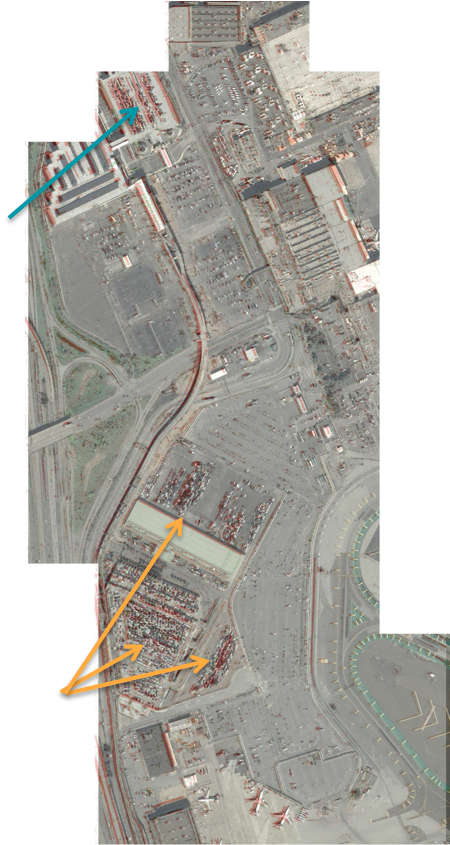
AIADS can easily discover in a few minutes such leading indicators that can help assess the economic recovery when it happens. This example is related to the travel industry but this can be applied to retail, movie theaters, and more.


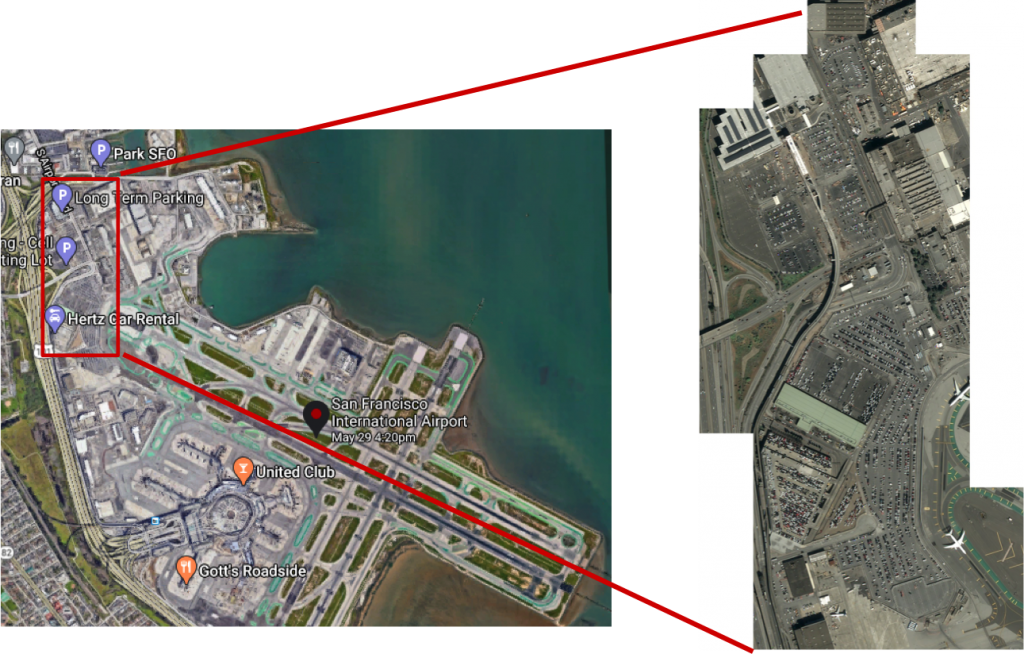
 Imagery credit: © CNES (2020), Distribution AIRBUS DS
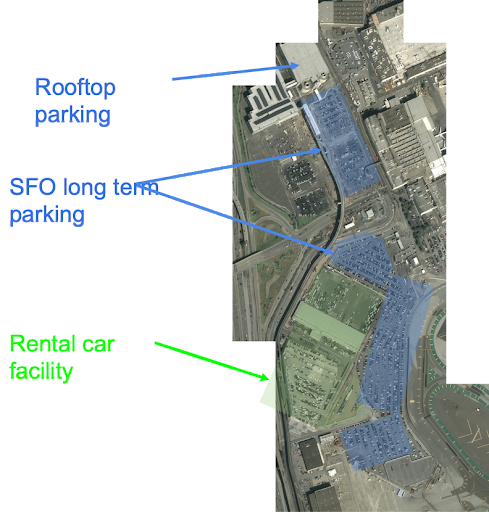
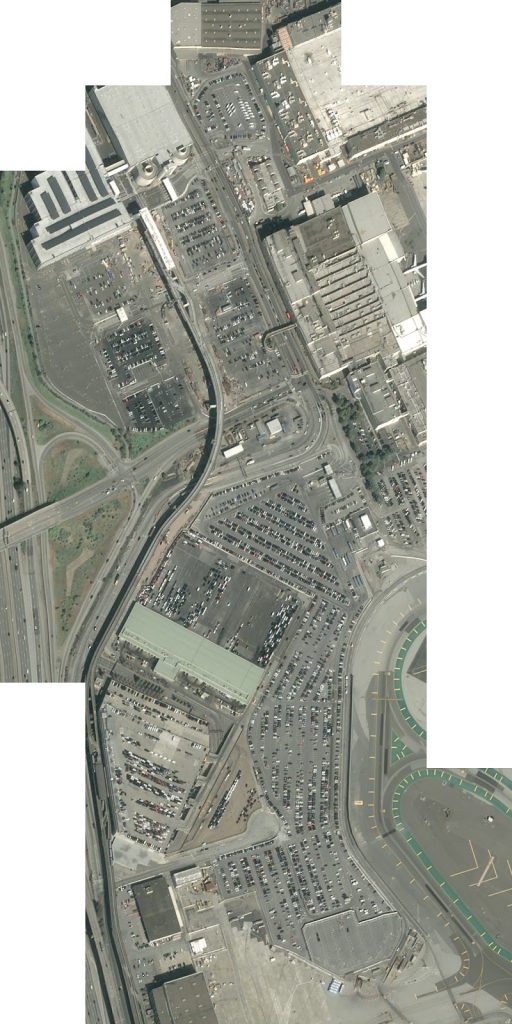
Simularity

Simularity